Using SCPI and PyVISA to Automatically Collect Data for ADC Characterization
This blog post is a copy pasted Monday Update I wrote for UBC Solar. So here are some defitions/explanations of terms & names:
People:
- Saman - UBC Solar Electrical Lead
- Mischa - Previous UBC Solar Electrical Lead and Previous BMS Lead
- Krish - Current UBC Solar BMS Lead
Terms:
- Monday - Our project management software
- SCPI - Standard Commands for Programmable Instruments
- AFG - Arbitrary Function Generator
- DMM - Digital Multimeter
- Nucleo - STM32 Nucleo Micro Controller
- HPPC - Hybrid Pulse Power Characterization (Battery test)
Context: This was part of a UBC Solar project to characterize the current sensor in our battery pack.
Github Project Link containing SCPI Python scripts & STM32 Project: here
Raw Data and Chart: here
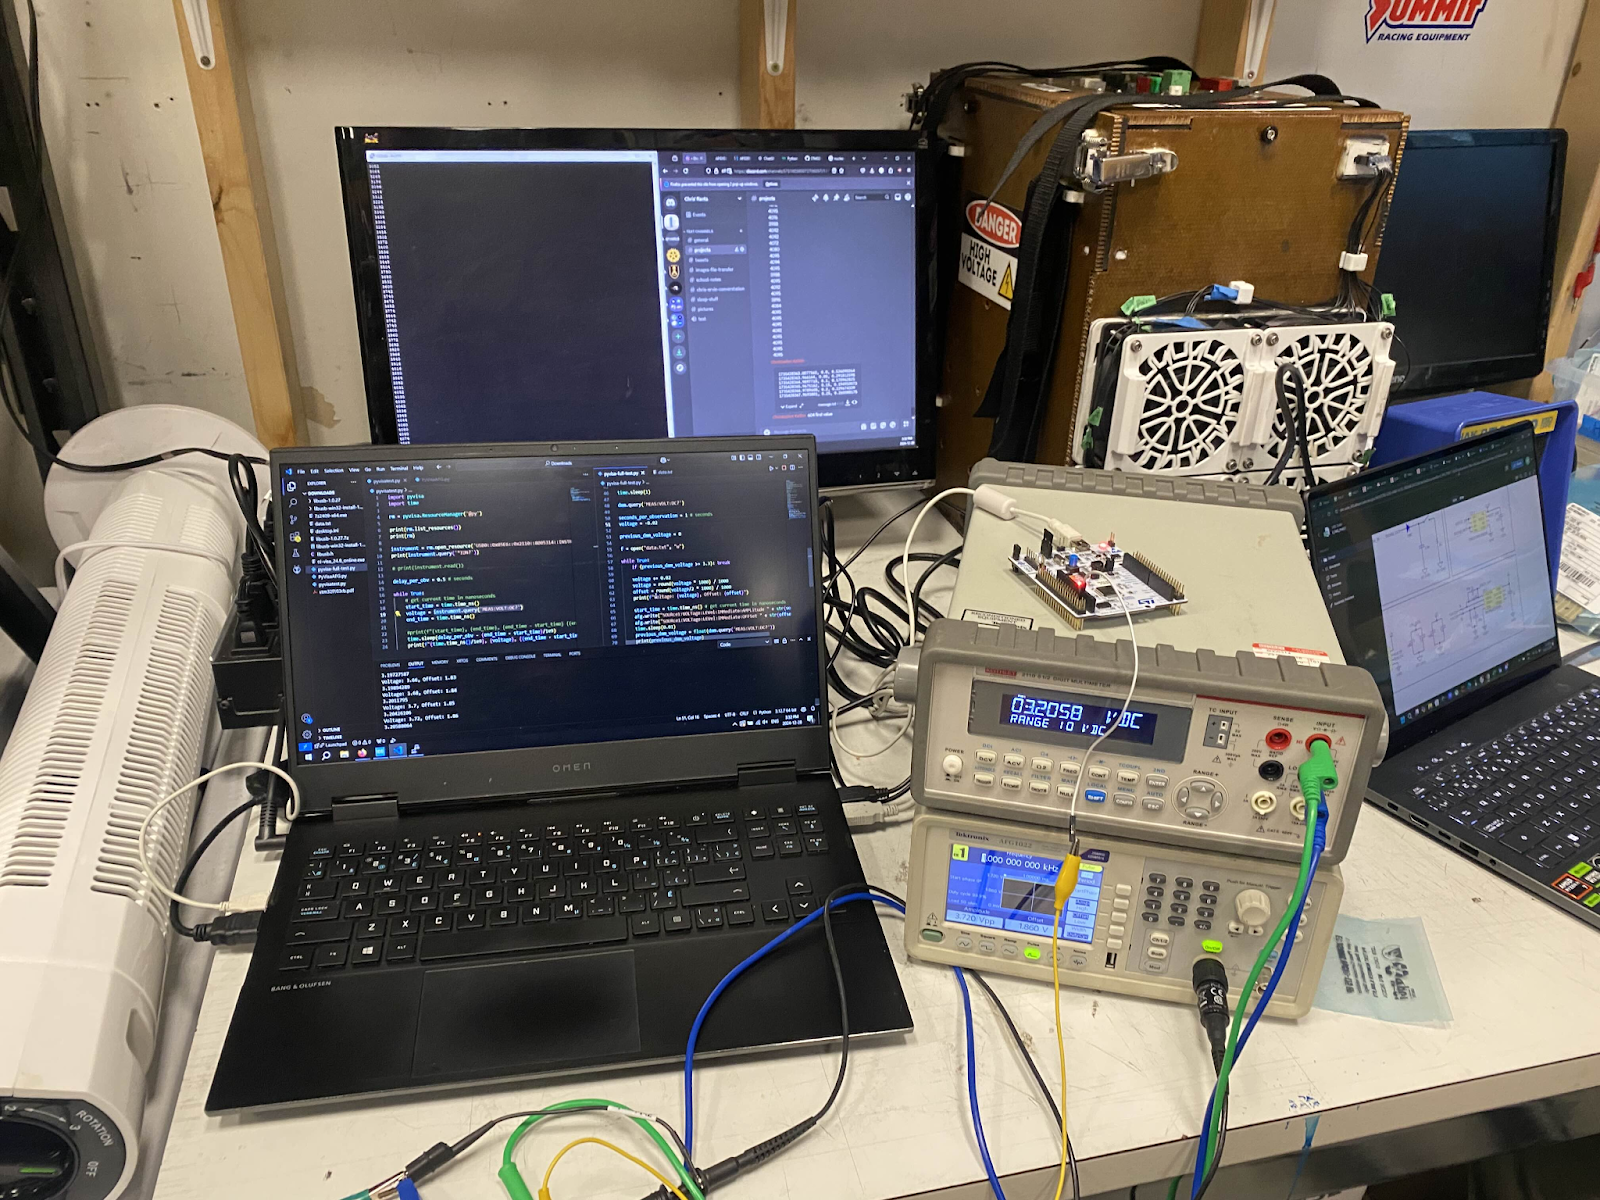
My final testing setup
This morning Saman suggested I find a way to use our Digital Multimeter (DMM) and other tools to automatically collect data for ADC characterization. In my previous Monday update I described how we can feed the output of the DAC into the ADC pin to automatically characterize an ADC over a range of voltage values. This plan falls through because I found that the DAC can’t be trusted to output a specific voltage value and needs to be characterized itself. The solution is to use external trustworthy equipment to complete the automatic characterization.
I started by figuring out how to program the DMM to automatically record and print values. SCPI (Standard Commands for Programmable Instruments) is the standard communication protocol to do this and there is a python library called PyVisa that allows for simple scripting. This took hours to set up and was most of my day, but it’s simple if you know what you’re doing, which now I do. If we plan to do similar tests in the future it would be useful for me to write a wiki page on how to set it up (automatic data collection like this was suggested for HPPC testing).
My goal was to automatically generate a voltage and read it with both our DMM and a Nucleo. This way we would assume the DMM is trustworthy and could characterize the error in the Nucleo’s ADC.
Our Power Supply doesn’t support SCPI and can’t be programmed, but our Arbitrary Function Generator (AFG) does support SCPI.
I wrote a script that made the AFG output a constant voltage that was read by the DMM. I ran this in a loop from 0 to 3.3V with a 0.02V step size. This 0.02V step size was use for the final of 5 tests I did with this script and is what generated all the charts in this update.
Note: the AFG doesn’t have a settings for a constant voltage, so I made it a pulse with a 99.9% duty cycle which appears to be close enough to a constant voltage for our purposes.
A step is done once per second, so a full test took ~4-5 minutes. This long step length is used so that the Nucleo, AFG, and DMM will be roughly synchronized without any communication between them. To illustrate, It’s easier to click start on both in a 1 second window than a 0.01 second window.
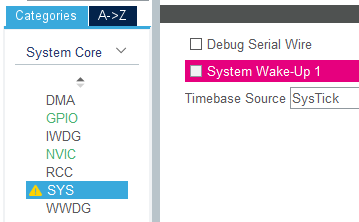
Side note: When Krish and I were testing the ECU a few weeks ago we lost the ability to upload code to the STM32 chip, we struggled for 1.5 weeks and Mischa solved our problem in 5 minutes by showing us the Debug Serial Wire toggle in STM32 Cube IDE. This came in handy when I was testing with the Nucleo today, without it my test would’ve been stopped in its tracks. Thx Mischa.
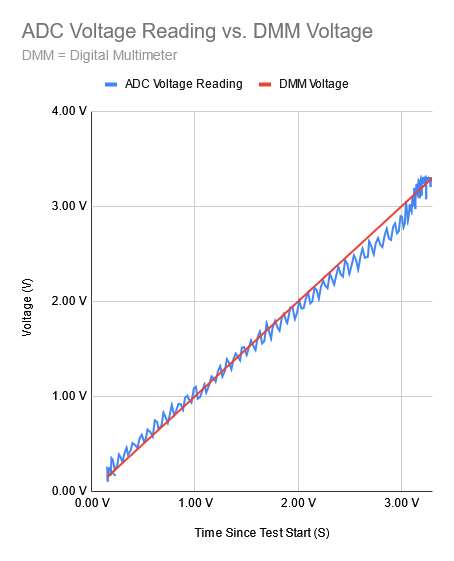
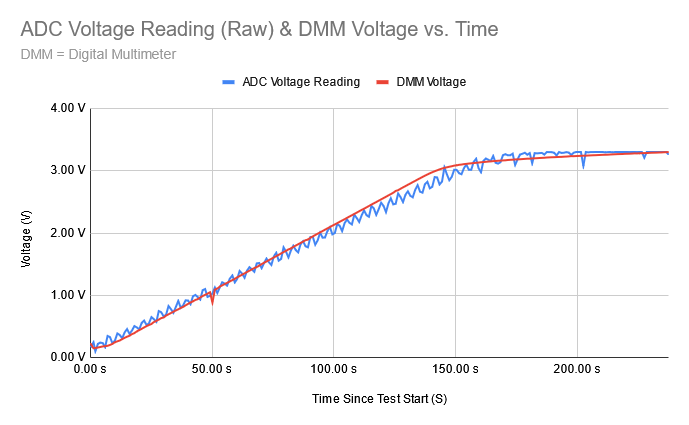
This is the graph that can be used to characterize the Nucleo’s ADC
As you can see in the graph above, there is a strange zig zag pattern in the graph of the ADC Voltage Reading. This isn’t exactly noise because it is very regular. There’s probably a fundamental reason for this that I am not aware of, but in future testing averaging can be used to get a smoother result. Also, I didn’t remember to measure the voltage reference for the Nucleo’s ADC so I assumed it was 3.3V.
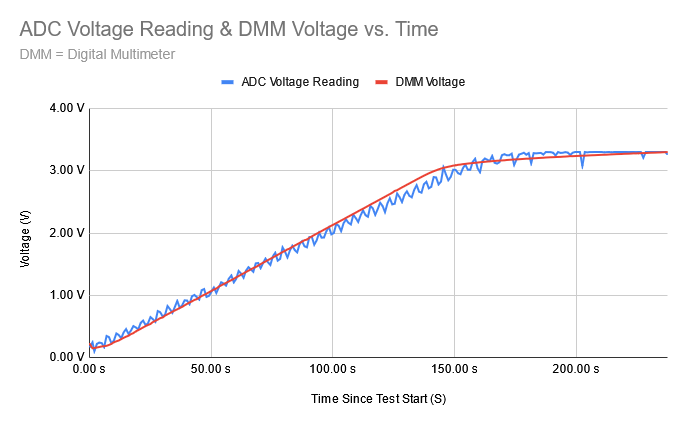
This graph shows observations versus time, not observation vs. observation like the previous graph. You can see recording over the 4 minute test.
The graph above shows that the rate of voltage increase after 3V is lower than that below 3 volts. My script increases voltage by 0.02V every second, so the voltage I am commanding the AFG to output does not match the voltage it is outputting.
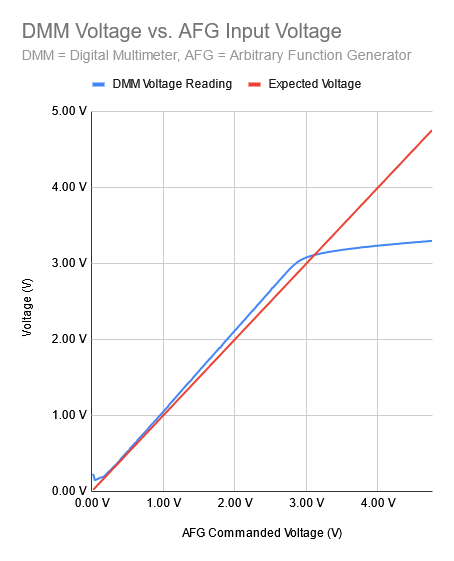
</i>Above ~3V, the AFG stops outputting the voltage it is commanded to.</i>
When plotting the AFG output voltage versus the expected AFG output voltage, we see what we expected to, after ~3V the AFG stops outputting the voltage is is commanded to. With some manual testing I found that when I set the AFG to 5V manually it does in fact output ~5V (~5.12V really, the AFG isn’t perfectly precise). So, there must be an issue with programming the AFG or with my code that causes the discrepancy between expected and real results.
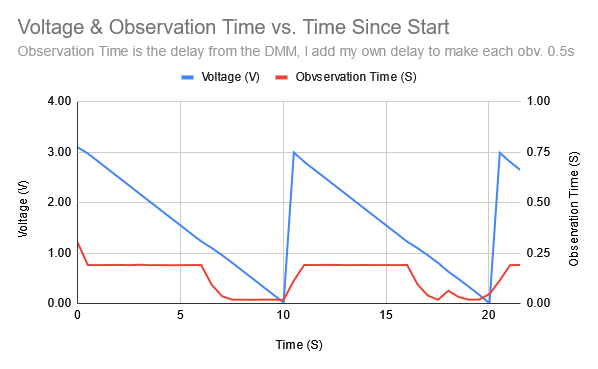
Notice that at above 1.23V the observations take ~10x longer than below 0.81V.
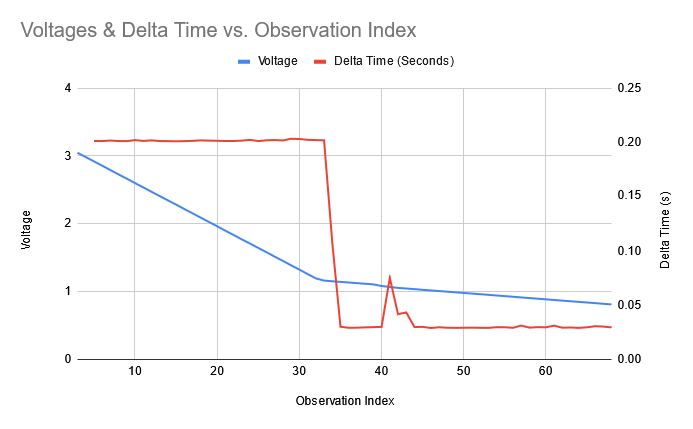
When we plot against observation index instead of the time stamp of the observation, we see the increase rate of observations after ~1.2V.
During initial testing I noticed that the DMM outputted values far faster lower voltages than at higher voltages. Because I assumed a constant time delta between observations, this discrepancy showed up as a bend in the graph of voltage vs. observation index which you can see in the second chart above (Voltages & Delta Time vs. Time Stamps).
I solve this problem by requiring each observation to be done at a constant cadence. I require 1 second per observation. To meet this requirement I take an observation and record how long it look, by using the expression delayTime = 1 - obvTime I find the remaining delay required to space each observation out by 1 second. The longest observation sets the minimum time required for all other observation if we want a constant cadence, so our theoretical minimum is ~0.3s. Read the Python script here.
Overall, this test made me learn a lot about SCPI and interfacing with electronic instruments. For our goal of more accurate current data, an automatic test setup like this isn’t strictly required. Recording values manually may take ~30 minutes while it took me ~5 hours today to set up automatic data recording - this could be reduced to ~1 hour of programming/setup for future tests. Although this might not be on the critical path for a more accurate current sensor, learning SCPI has value in and of itself and this knowledge may prove valuable in the future.
Updates:
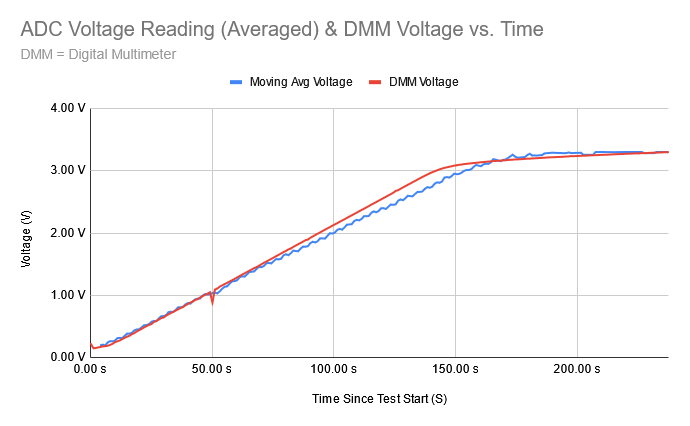
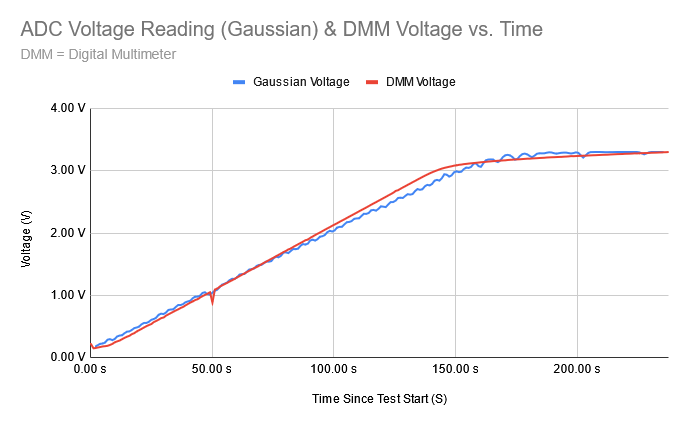
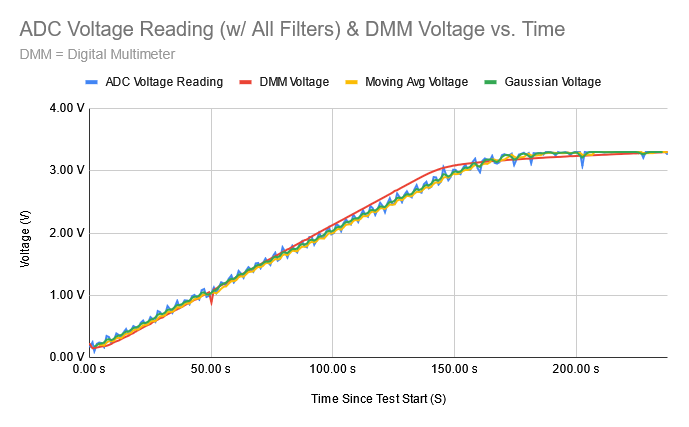
At Saman’s request, here are ADC Voltage Reading & DMM Voltage vs. Time graphs but with averaging and gaussian filters applied.
The average takes the sum of the previous 4 values and the current value and divides by 5. The Gaussian uses a 0.06, 0.24, 0.4, 0.24, 0.06 filter centered on the current value.
