Terraform Industries Electrolyzer Economics Modelling
This is part one in my three part series of blog posts on modelling the economics of Terraform Industries:
- Terraform Industries Electrolyzer Economics Modelling (You are here)
- What Commodity Prices Are Required For Terraform Industries To Be Competitive?
- The Path To 1 ¢/kWh Solar Costs for Terraform Industries
If you have feedback or criticism, please reply here.
Here’s the link to all the code, my notes, and spreadsheet.
One of the beautiful charts that came out of this modelling.
In 45 days I will begin work at Terraform Industries as a Mechanical Engineering Intern. At that time I must be able to hold my own in a conversation about the economics of the Terraformer and have sufficient knowledge of the entire design space. To this end, I’ve spent nearly every waking minute of my last 52 hours researching and modelling the Terraformer.
As a primer, Terraform Industries is a startup that is developing a process to synthesize Natural Gas from Sunlight and Air. Natural Gas is CH4, you can get the C from atmospheric carbon dioxide and the H from water. By creating a process that leverages very cheap solar energy (direct DC from the solar, not going through the electrical grid) to power this process, they can produce Natural Gas at a cost that is competitive with fossil Natural Gas. This closes the carbon cycle but more importantly gives us abundant and cheap fuels anywhere in the world with enough sunlight to sustain agriculture.
Casey Handmer has written at length about the specific strategy of Terraform Industries, and I implore you to read these blog posts:
- Terraform Industries Whitepaper
- To Conquer the Primary Energy Consumption Layer of Our Entire Civilization
51 hours and 27 minutes ago I read this blog post by Klaasnotfound which criticizes many of Terraform Industries approaches. To ensure that the company I aspire to work at for decades is not firmly rooted in a flawed strategy, I decided to do my own due diligence, and this blog post covers just the Electrolyzer economics portion of that due diligence.
Electrolyzer Cost Vs Efficiency
Terraform Industries gets their hydrogen from electrolysis which uses an electrochemical cell to split H2O into H2 and O2. There are several methods of electrolysis including Alkaline electrolysis, Proton Exchange Membrane (PEM) electrolysis, and Anion Exchange Membrane (AEM) electrolysis, etc. For the purposes of this analysis, the technical details behind each method are unimportant and the economic model is agnostic to the method, it only cares about the cost and efficiency of the process.
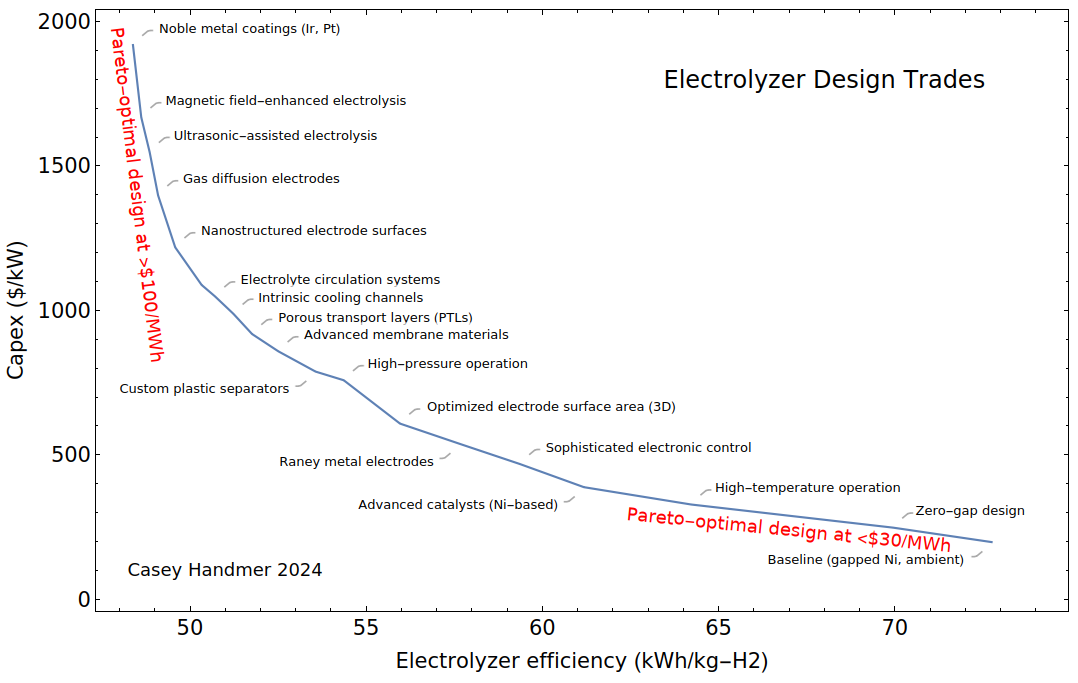
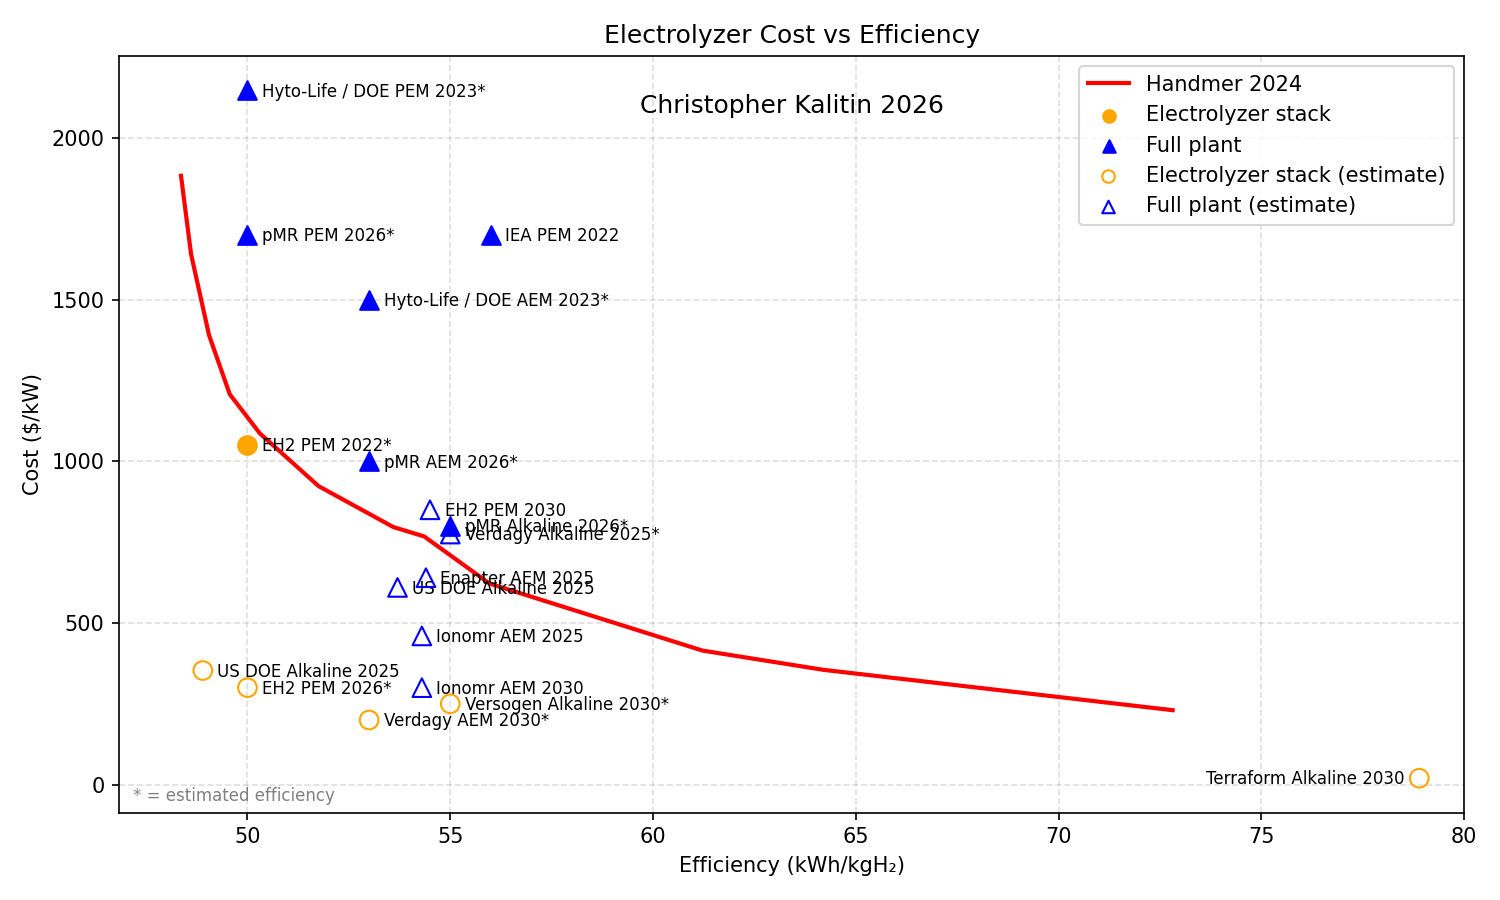
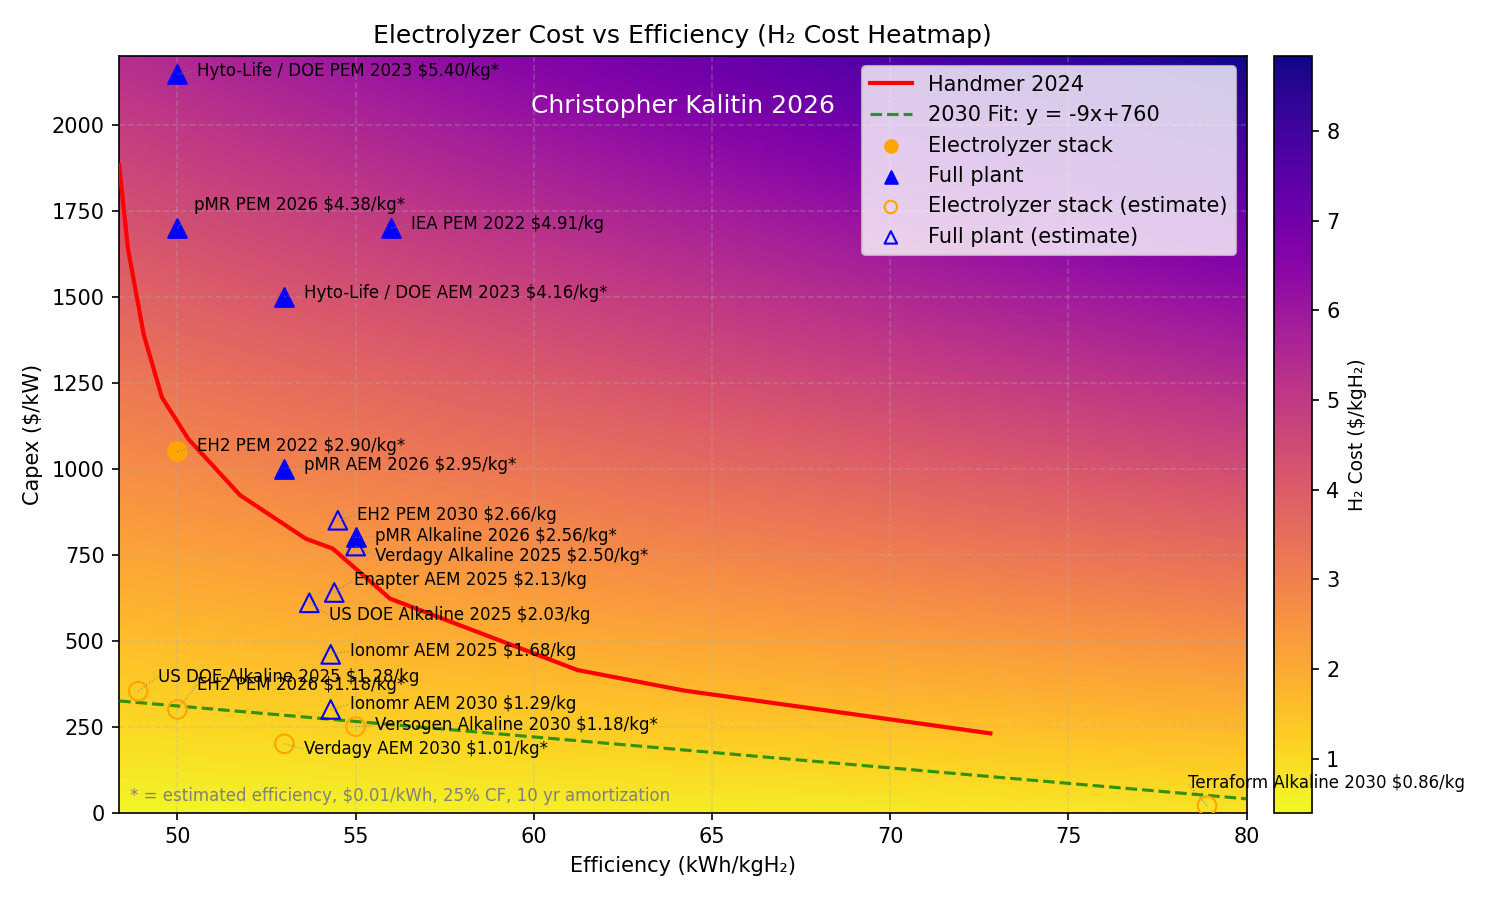
Above is a chart from Casey Handmer’s blog post How to Produce Green Hydrogen for $1/kg that shows the capex cost ($/kW, cost per power input) of an electrolyzer vs its efficiency (kWh/kgH2). Handmer’s goal here is to model the relation between cost and efficiency of electrolyzers given various design decisions.
To illustrate $/kg, he uses the example of a kettle at 20 $/kW, as a kettle uses ~1 kW and costs ~$20. Efficiency is measured in kWh/kgH2 here, not percent as you may be used to. The energy content of 1 kg of H2 is 39.4 kWh, so we can compute efficiency as kWh required to produce 1 kg of H2 divided by 39.4 kWh, but we don’t do that here because % efficiency isn’t that important.
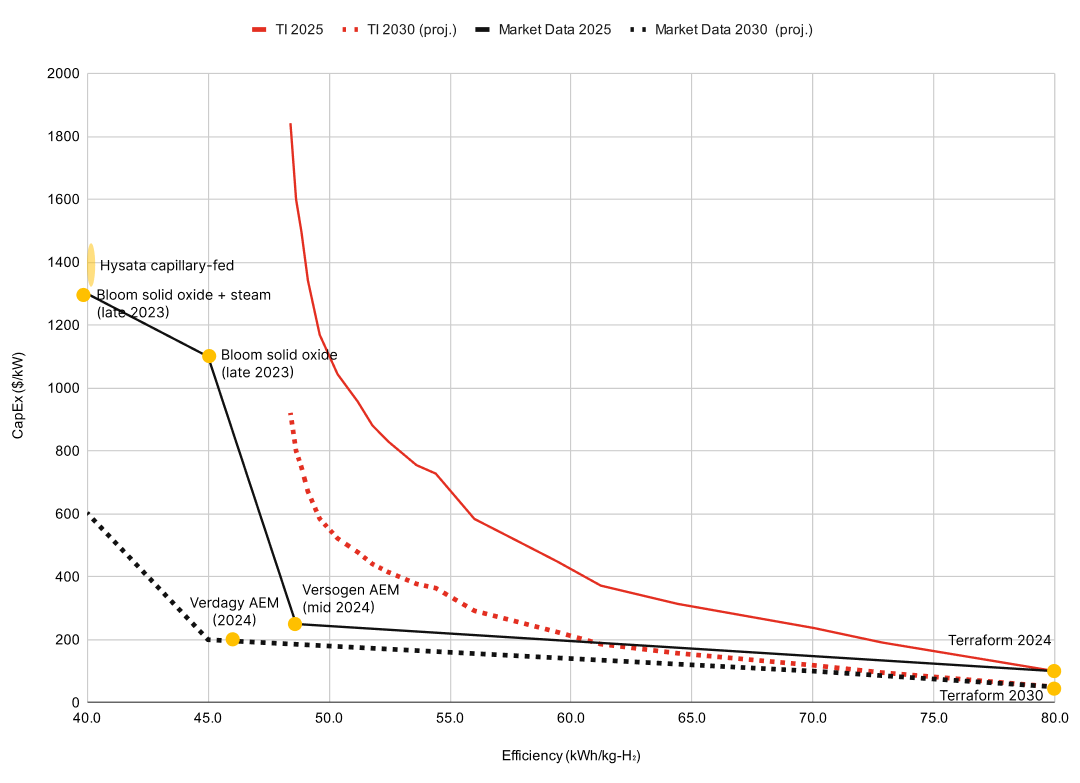
In Klaas’ analysis, he overlayed Casey Handmer’s model of electrolyzer cost with data points on electrolysis costs from various companies. It shows that the cost at higher efficiency could be much lower than Handmer predicted, which is potentially a big indictment of Terraform’s strategy!
Klaas makes the mistake of using aspirational forward-looking numbers for electrolyzer stack cost from strange sources, instead of more concrete data points from actual electrolyzer plants. I took a more nuanced and rigorous approach by collecting more data points and sorting them into electrolyzer stack vs full plant costs and estimates vs actual costs. I go into more detail in my notes (ctrl-f “BLOG POST READERS CTRL F HERE” to get to the specific section).
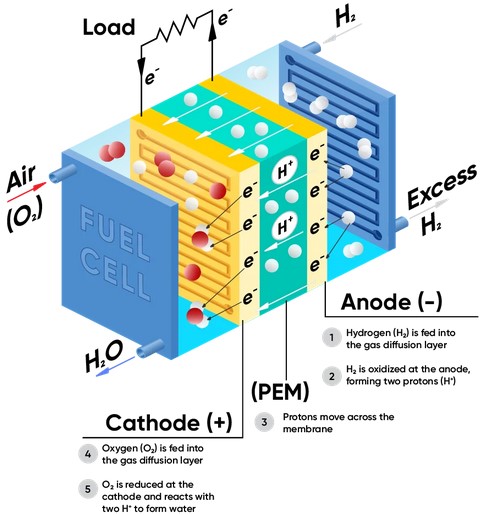
This shows one electrolyzer cell, many of which are combined into an electrolyzer stack, and many stacks are combined into an electrolyzer plant.
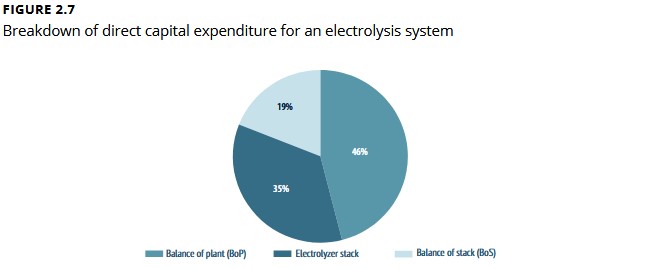
Sourced from this World Bank Technical Report
An electrolyzer stack is the core part of the electrolyzer that contains the electrochemical cells, and is a subset of the cost of an entire electrolyzer plant. As the pie chart above from the World Bank shows, it’s very important to distinguish between these two costs as the Electrolyzer stack is only one component of cost.
Sources available here
When I plot the data with the distinctions mentioned above, we notice that there are no functioning electrolyzer stacks or plants below Handmer’s line (save one that I had to estimate the efficiency of using this paper).
Given Handmer’s analysis was done in 2024, it appears to be perfectly calibrated prognostication.
Furthermore, Klaas’ optimistic data points for AEM electrolyzers are not suitable comparisons to compare against Handmer’s 2024 analysis. The rest of this blog post will be focused on comparing the optimistic estimates of AEM electrolyzers to Terraform’s strategy. If AEM electrolyzers really are ~$250/kW at ~50 kWh/kgH2, does this pose issues for Terraform’s strategy long-term?
Electrolyzer Cost vs Capex (a function of efficiency)
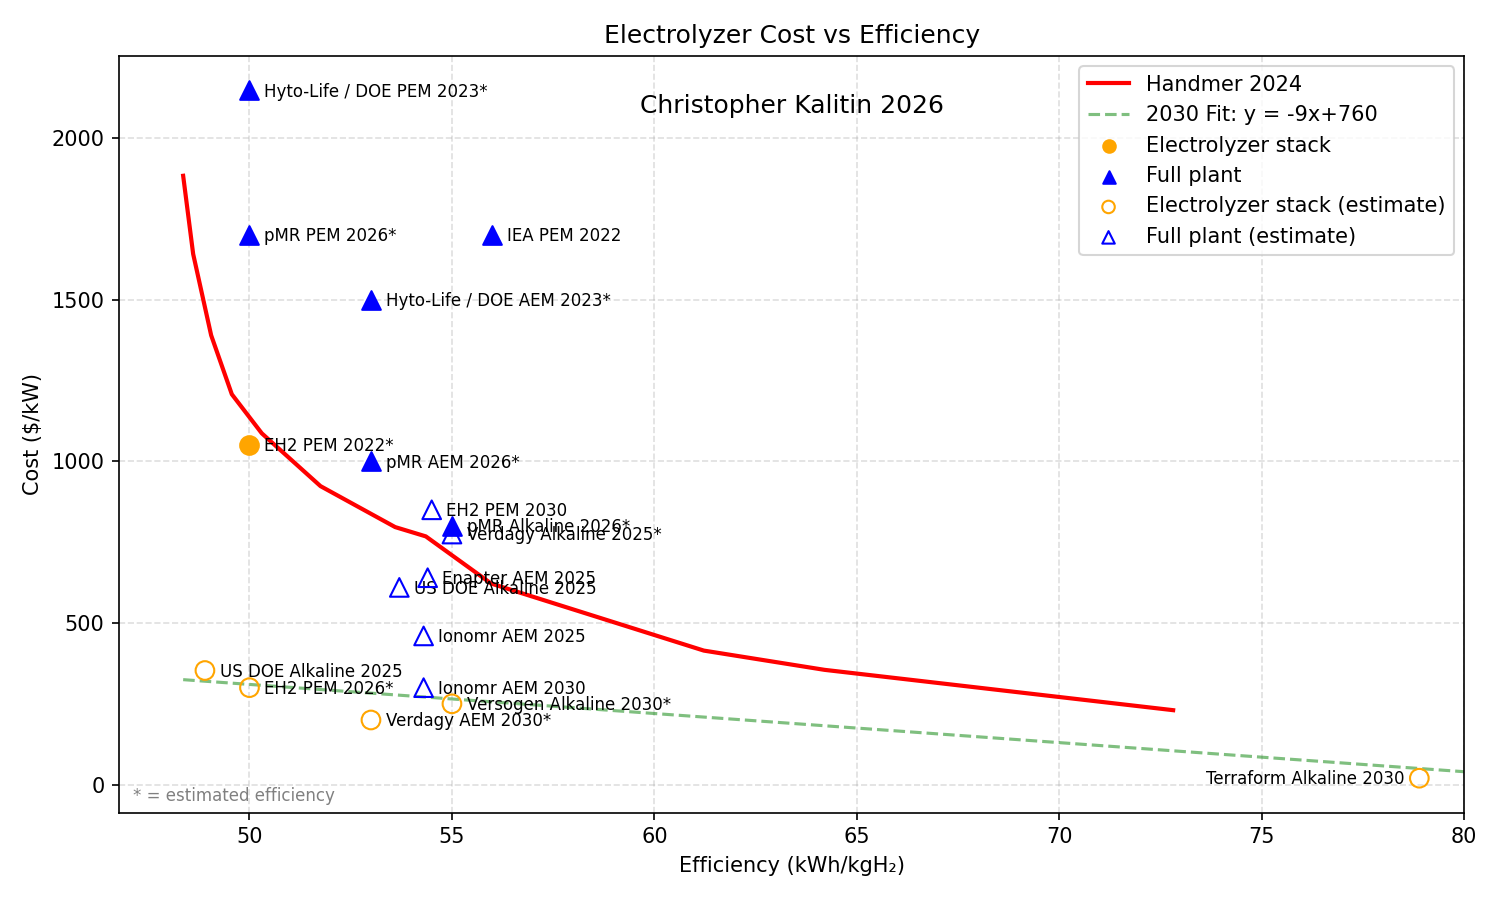
To continue modelling design tradeoffs between various electrolyzer processes, I fit a curve to the 2030 estimates of electrolyzer capex cost vs efficiency. This fit is shown above as the green dashed line. It’s slightly pessimistic for the high-efficiency data points as it mainly ignores the Verdagy AEM 2030 data point. It’s also slightly pessimistic for Terraform’s long-term target of $20/kW at 50% efficiency (78.89 kWh/kgH2) as the fit results in ~$40/kW at that efficiency. It seems to be a happy medium.
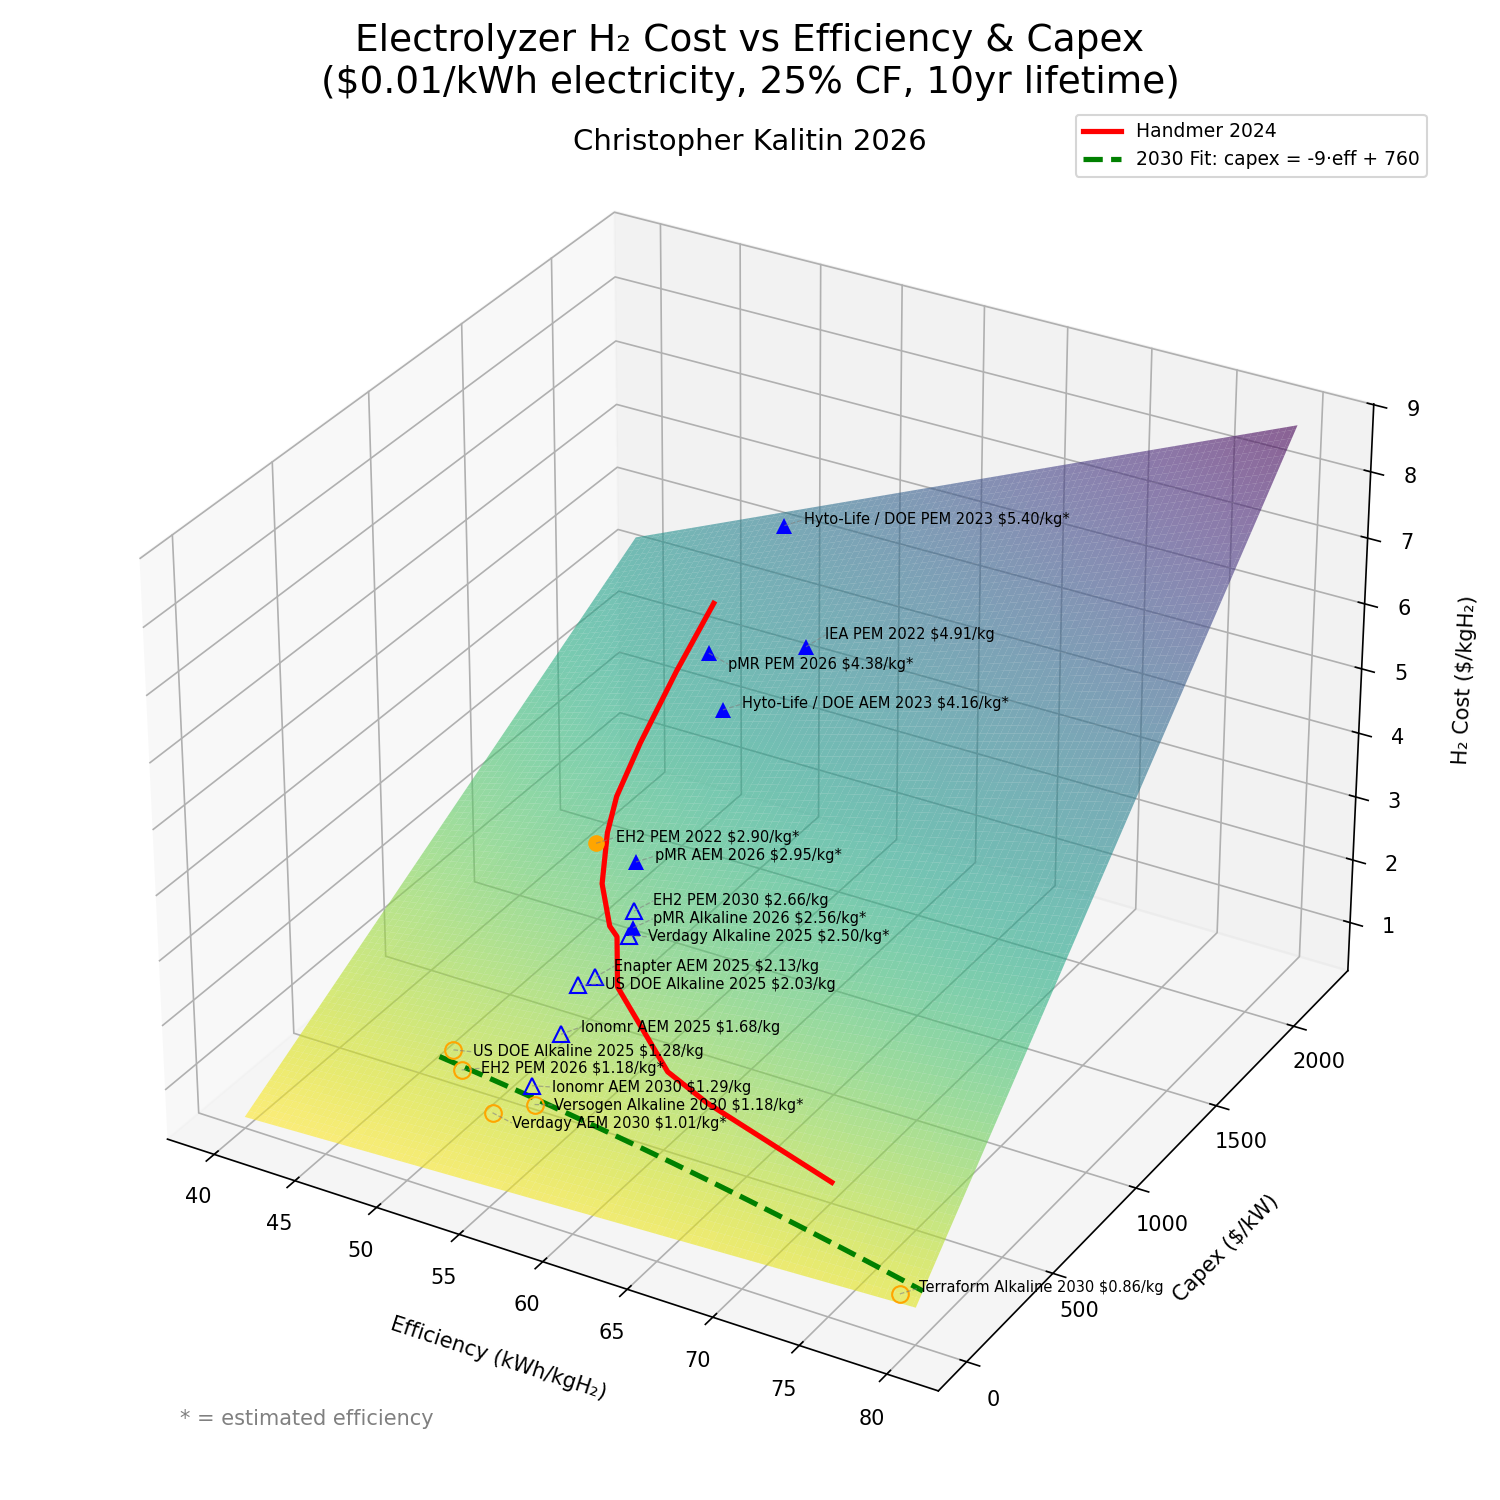
With Handmer’s function of cost vs efficiency and my fit of cost vs efficiency in 2030, we can model the cost of hydrogen as $/kgH2. Both of these lines are used as translations between efficiency and cost, so we can plot the data with two x axes, as shown below.
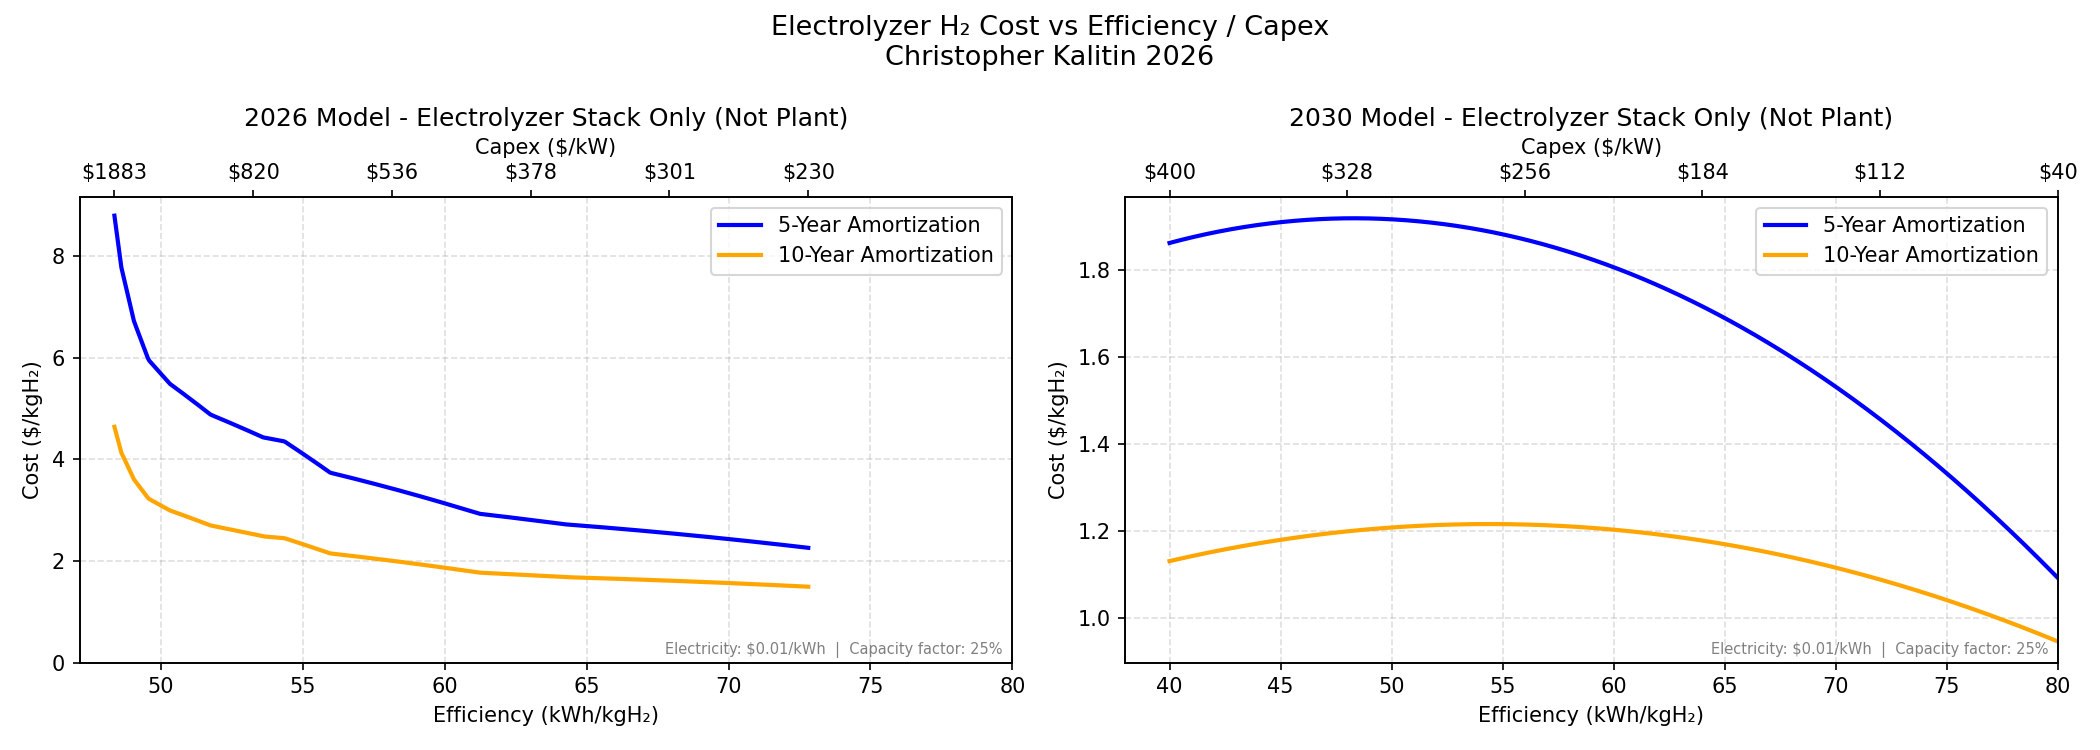
In Handmer’s model we see that the lowest cost for Hydrogen (assuming one cent per kWh, 25% capacity factor, and 10 year amortization) is around $1.5/kgH2. In my 2030 model, the cost is ~$0.95/kgH2.
We see that currently the Terraform strategy is obviously the valid optimization, but if we assume high-efficiency electrolyzers get significantly cheaper by 2030, the difference between Terraform’s strategy and the high-efficiency strategy becomes smaller. There are some limitations to just assuming a line that goes to 40 kWh/kgH2, but the difference in cost is ~20% instead of a couple multiples.
We also see that higher efficiency processes are much more sensitive to the amortization period, as they have higher capital expenditures initially, whereas Terraform’s strategy is to deliberately target lower capex with an efficient process, resulting in net lower costs. More on this later.
Note that the 2030 model is a downwards parabola because cost is a function of efficiency multiplied by capex, and capex is a function of efficiency (the green dashed line a few charts ago). So, cost is quadratic with respect to efficiency. This is shown in this cost_per_kg function.
Visualizing Cost vs Efficiency and Capex Simultaneously
Above are two charts that overlap the cost of hydrogen onto the cost vs efficiency graphs from earlier. I Claude Coded these charts initially and the 3d one was a little much (no need for a 3d chart here, 2d with heatmap is enough DoF), but it still looks nice so I kept it in with the 2d heatmap version.
The lightest (yellow) parts of the charts are where you want to be. We see that Terraform’s strategy is a valid optimization for lowering cost if you’re along the red or green lines. Obviously you can’t go too far off these lines because no extremely low cost high efficiency electrolyzers exist.
For my analysis I’ve been assuming 1 cent per kWh, 25% capacity factor, and 10 year amortization. I used 10 year amortization because most of the AEM / PEM methods I found assumed 10 year amortization (sources in this spreadsheet). If we were to assume a shorter amortization period (Terraform is targeting 5 years), the Terraform’s strategy looks even better.
“Why do we care? Does it even matter? If both approaches produce hydrogen at around $1.12 per kg, wouldn’t Terraform’s approach still be preferable because it doesn’t need batteries, energy management logic etc.? Well, no - because while the price per kg may be the same, the AEM electrolyzers will produce much more hydrogen! Running Terraform’s hypothetical 1 MW electrolyzer for 12,500 hours (25% of 50,000 hours) will produce 12,500,000 kWh / 80 kWh/kg-H₂ = 156,250 kg-H₂ over its lifespan (as noted in their blog post). Running a 1 MW AEM electrolyzer with cel = 200 $/kW and ηel = 45 kWh/kg‑H₂ for 17,500 hours (35% of 50,000 hours) will yield 388,888 kg-H₂, which is almost 2.5 times as much. For $1.11 per kg.”
– Klaas, in his write-up
At this point, I’d like to make a criticism of one of Klaas’ points. We all make such mistakes and at times don’t think enough about what we say - as I might have done in this analysis - but that doesn’t mean I won’t call you out on it.
Above he says that even though Terraform and the AEM electrolyzers he benchmarks them against have the same cost per kg of hydrogen, the AEM electrolyzer still wins because it will produce more hydrogen with an equally sized solar array. This completely misses the point that we’ve already factored the cost of the solar array into our analysis with the operating cost of electricity ($0.01/kWh).
Sure, a more efficient electrolyzer will produce more hydrogen with the same solar array compared to Terraform’s process, but it would also be more expensive to build! We’ve already factored this into our analysis!
Opex vs Capex Breakdown
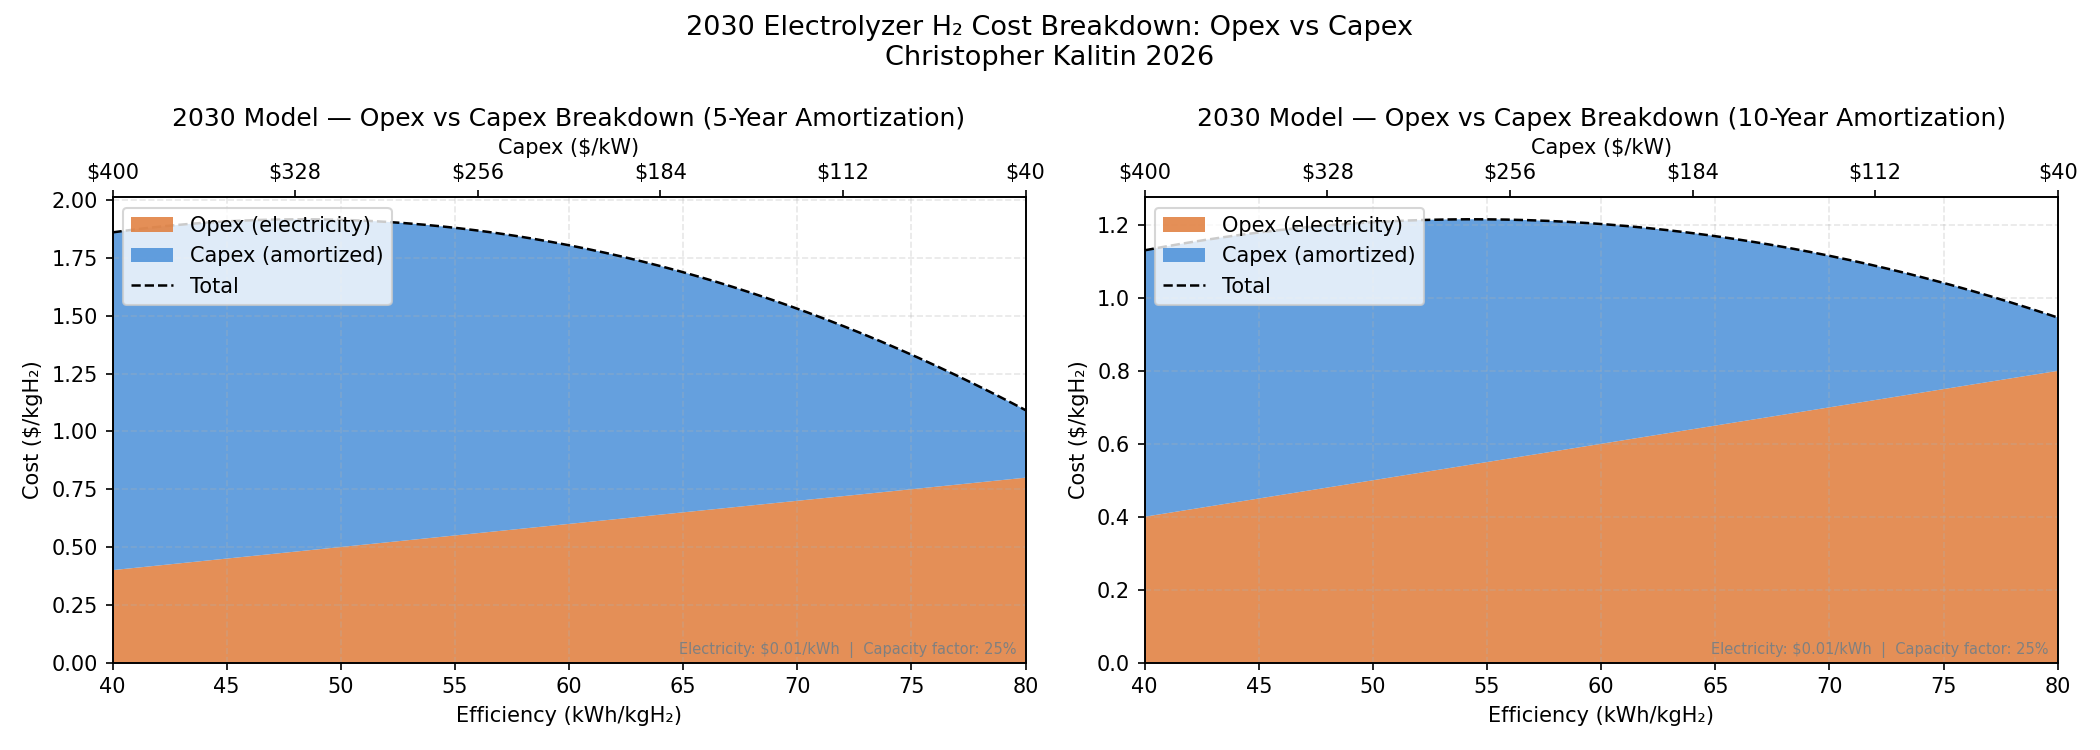
As I mentioned earlier, higher efficiency processes have much more of their cost coming from capex, whereas lower efficiency processes have much more of their cost coming from opex. This is because higher efficiency processes are more expensive to build but cheaper to operate, and lower efficiency processes are cheaper to build but more expensive to operate. The operating cost is purely the cost of electricity.
By Amdahl’s law, we want the primary cost driver to be what we have the most control over. If we have most control over capex but capex is only 10% of the cost, then even if we completely eliminate capex cost and the machine is free our hydrogen still costs 90% of what it did before.
“How do I have a short position on the future price of solar? The answer is you want to go and build machines that consume an enormous amount of solar. Those machines have to be relatively cheap, so they have good investment rate of return.”
- Casey Handmer, Rational Optimist Podcast 20:10
The strategy of Terraform Industries is to bet on the declining cost of solar PV modules to reduce the cost of their process over time without any direct involvement. This necessitates targeting a process that is more sensitive to electricity costs, which means targeting a process with lower efficiency and lower capex. Now the optimization is to get the capex low enough that the electricity cost dominates, instead of amortizing capex over a longer period of time, as you’re incentivized to do with a capex-intensive process.
Klaas, in his post, questions Terraform’s goal of fully amortizing costs over a 5 year period and this illustrates why it’s a valid strategy. With extremely low capex, we can amortize over a shorter period of time because the upfront cost is so low.
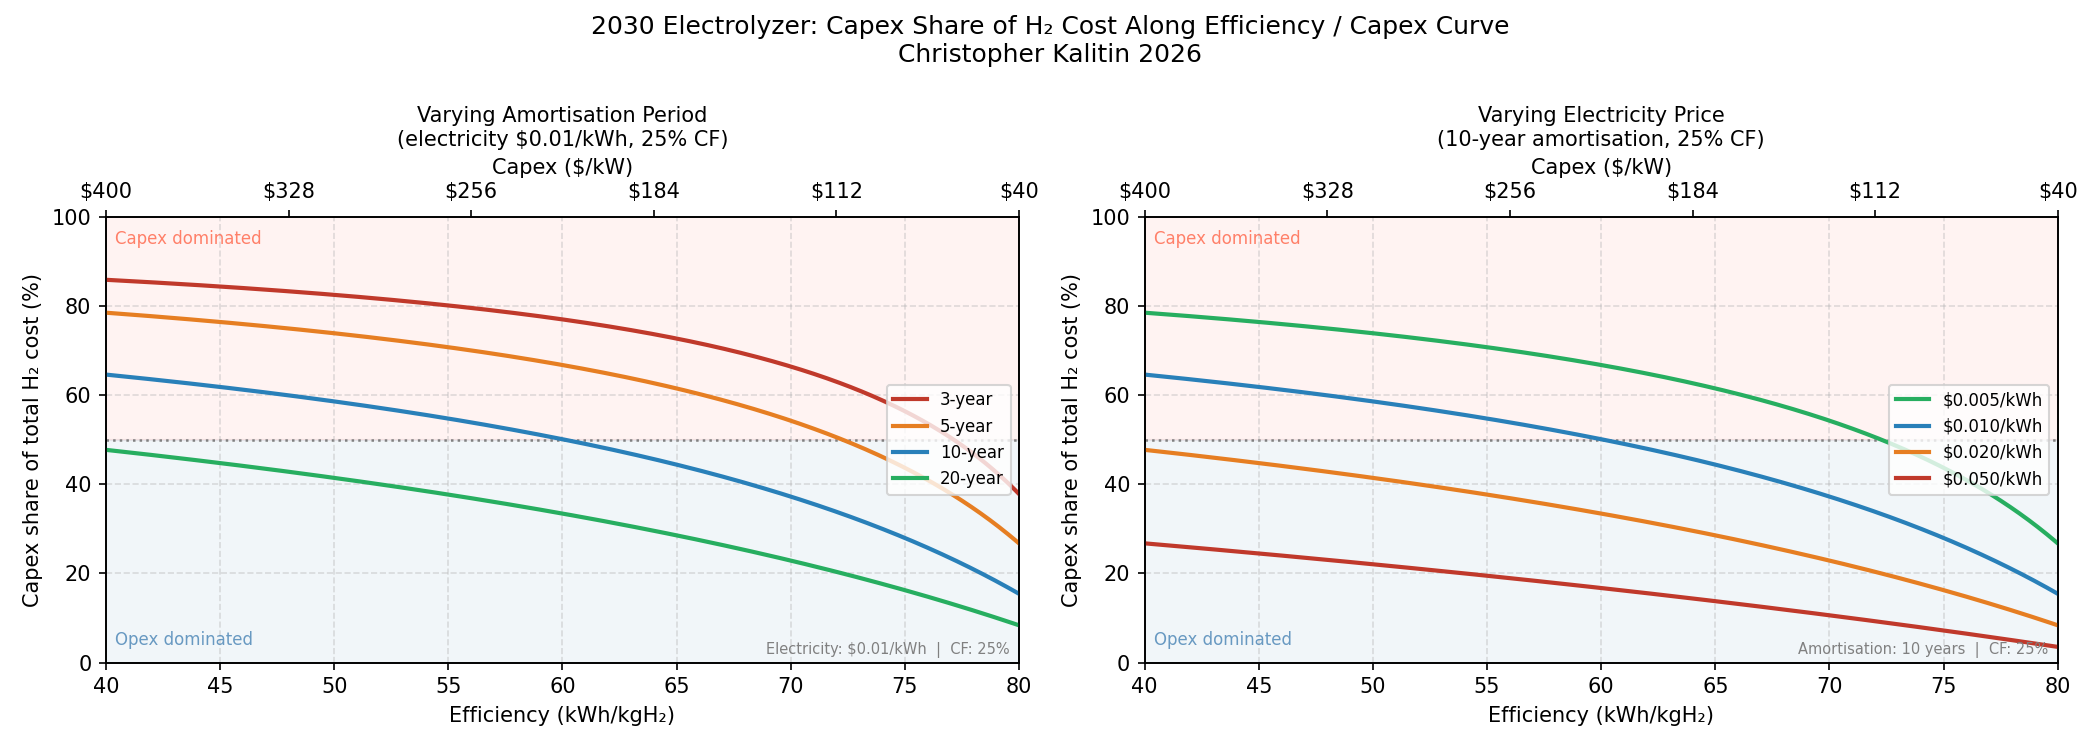
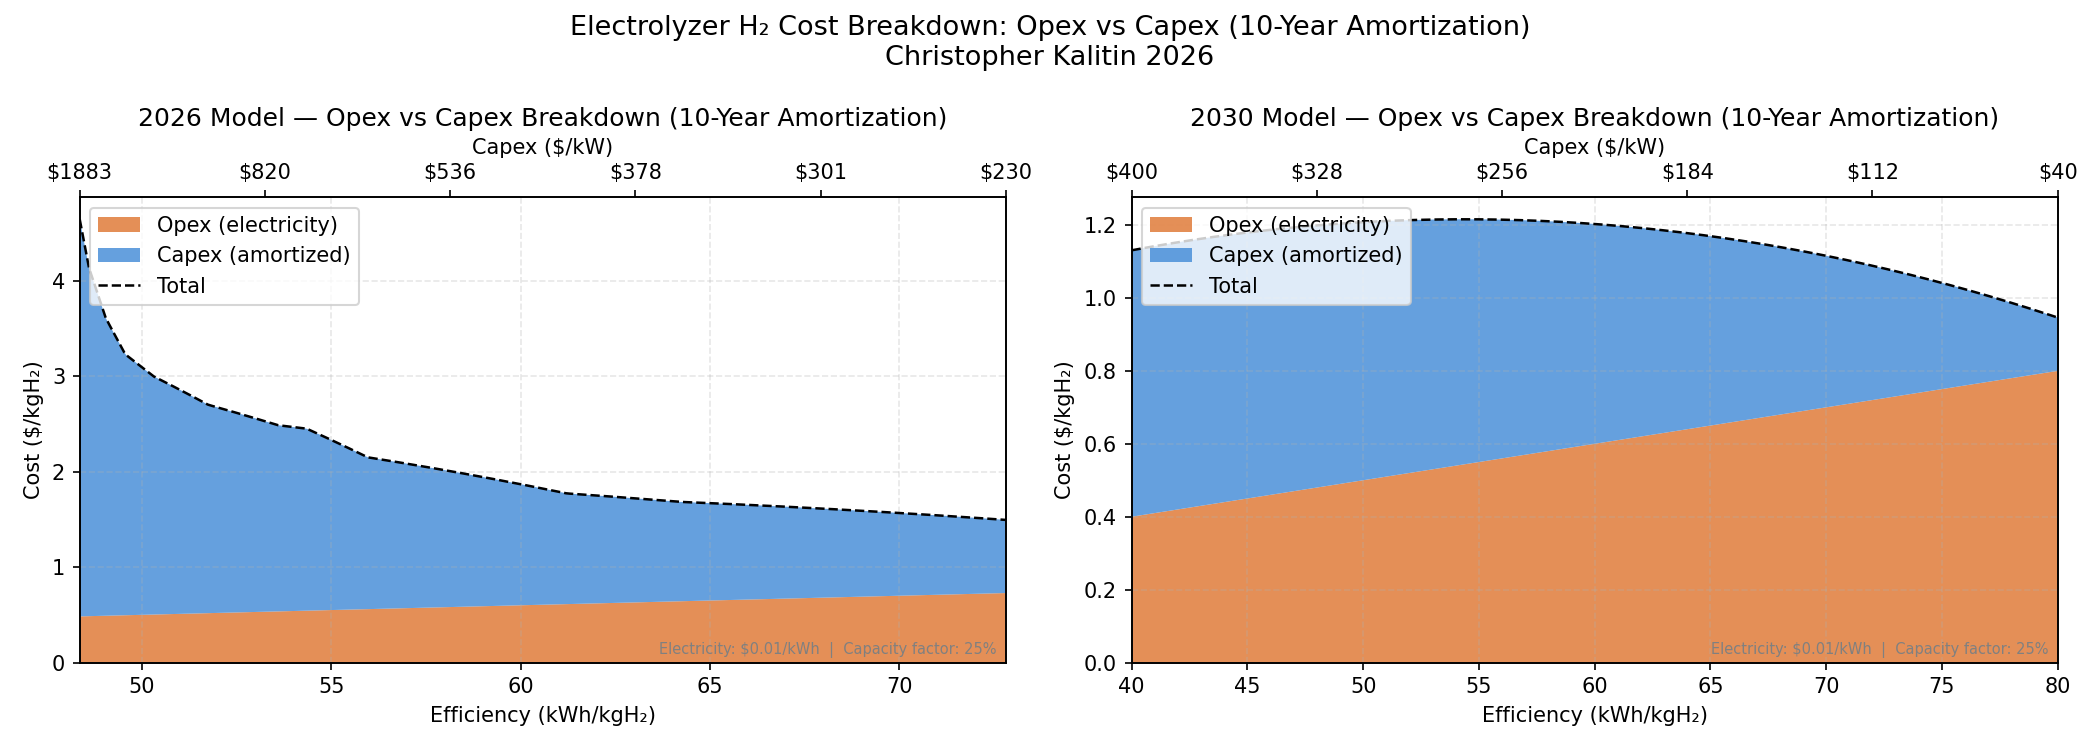
The charts above - the final ones of this analysis - show the share of net cost that is attributed to capex vs opex for various efficiencies, amortization periods, and electricity costs. These charts simply show the percentage of the blue section in the previous charts.
Notice that for high-efficiency high-capex processes we need to use 10 year amortization cycles or greater to minimize cost. This poses some issues with financing, and the design optimization becomes increasing capex even further so that your electrolyzer will last longer.
In contrast, for low-efficiency low-capex processes we can use much shorter amortization cycles as the cost of electricity dominates. 5-10 years appears optimal, and Terraform is targeting 5 years. Furthermore, this cost automatically decreases over time! Once you build a plant you’ll be locked into the cost of the solar modules (unless you use excess power from a renewable grid at low capacity factor, like Tony Seba’s Superpower, more on this in a future blog post). However, as the cost of solar modules decreases, the cost of new Terraformers also decreases. This is to say it’s a forward-looking strategy, not one that can do much for plant already built.
I was particularly excited when I came up with the charts above because it perfectly illustrated why Handmer’s strategy of amortizing over 5 years is so important. With low capex it’s extremely possible to do this! I was initially skeptical of this strategy after I read Klaas’ criticism of it, but like Heisenberg said, I saw Handmer staring back at me in the end, on this ground he had already trod, independently coming to the same conclusion.
Final Notes
My assumption of $0.01/kWh is very optimistic, and something I’ll explore in a future blog post. This cost assumes the Electrolyzer is powered directly from the solar array, without going through inverters or MPPTs (the electrolyzer is its own MPPT, more on this in the future). This way, you can eliminate all unneeded circuitry except contactors. Klaas explores this in his post and is skeptical of how low the price of such electricity can get, hence the need to do my own analysis!
I am extremely happy to have the opportunity to work under Casey Handmer and at Terraform Industries, a company with such a grand vision for the future of humanity. That he did such an analysis years before everyone else (The Terraform Whitepaper was released in 2022) and built a company around it is a testament to not just his ability to accurately predict the future - Elon’s definition of intelligence - but also his ability to execute on that vision. He is a visionary in the true sense of the word, a man with a vision for the future that he must build.