Battery Storage For Hydro Dominated Grids
If you have feedback / criticism, please reply here.
A look at what’s ahead in this analysis.
Some astute observers of battery energy storage systems have pointed out that by colocating grid storage batteries with legacy power plants you can greatly increase their capacity factor.
Essentially, this idea is that you can take a natural gas power plant that operates 50% of the time, colocate a large grid-scale battery with it, and unlock a tremendous amount of capacity.
Because the turbines are sized for the highest power usage on the worst day of the worst decade, during a regular day they have lots of unused capacity. To access that capacity, you can just put a battery next to the power plant to deal with the times at which power is in greatest demand (eg. when everyone gets home every evening) and enjoy extremely low cost already amortized energy at all other times.
Recently I’ve been thinking about how we can extend this idea to hydro power plants. I had a hypothesis that you could greatly decrease the required turbine size of hydro power plants if you colocated grid storage batteries with dams. This way you can lower overall system cost while maintaining the same ability to output power.
This blog post is an exploration of that idea: the promise of colocating grid storage batteries with hydro power plants to decrease net system cost and LCOE.
All modelling and raw data is available in this Github repo.
Learning The Problem Space
Before we can model a pure hydroelectric system vs a dam colocated with a battery, we have to learn how dams interface with the grid and what role they play.
For this analysis, we’ll use data from the Bonneville Power Authority. The BPA provides power to the American Pacific Northwest and provides a great dataset for a hydro-dominated grid (~65% of electricity is sourced from dams).
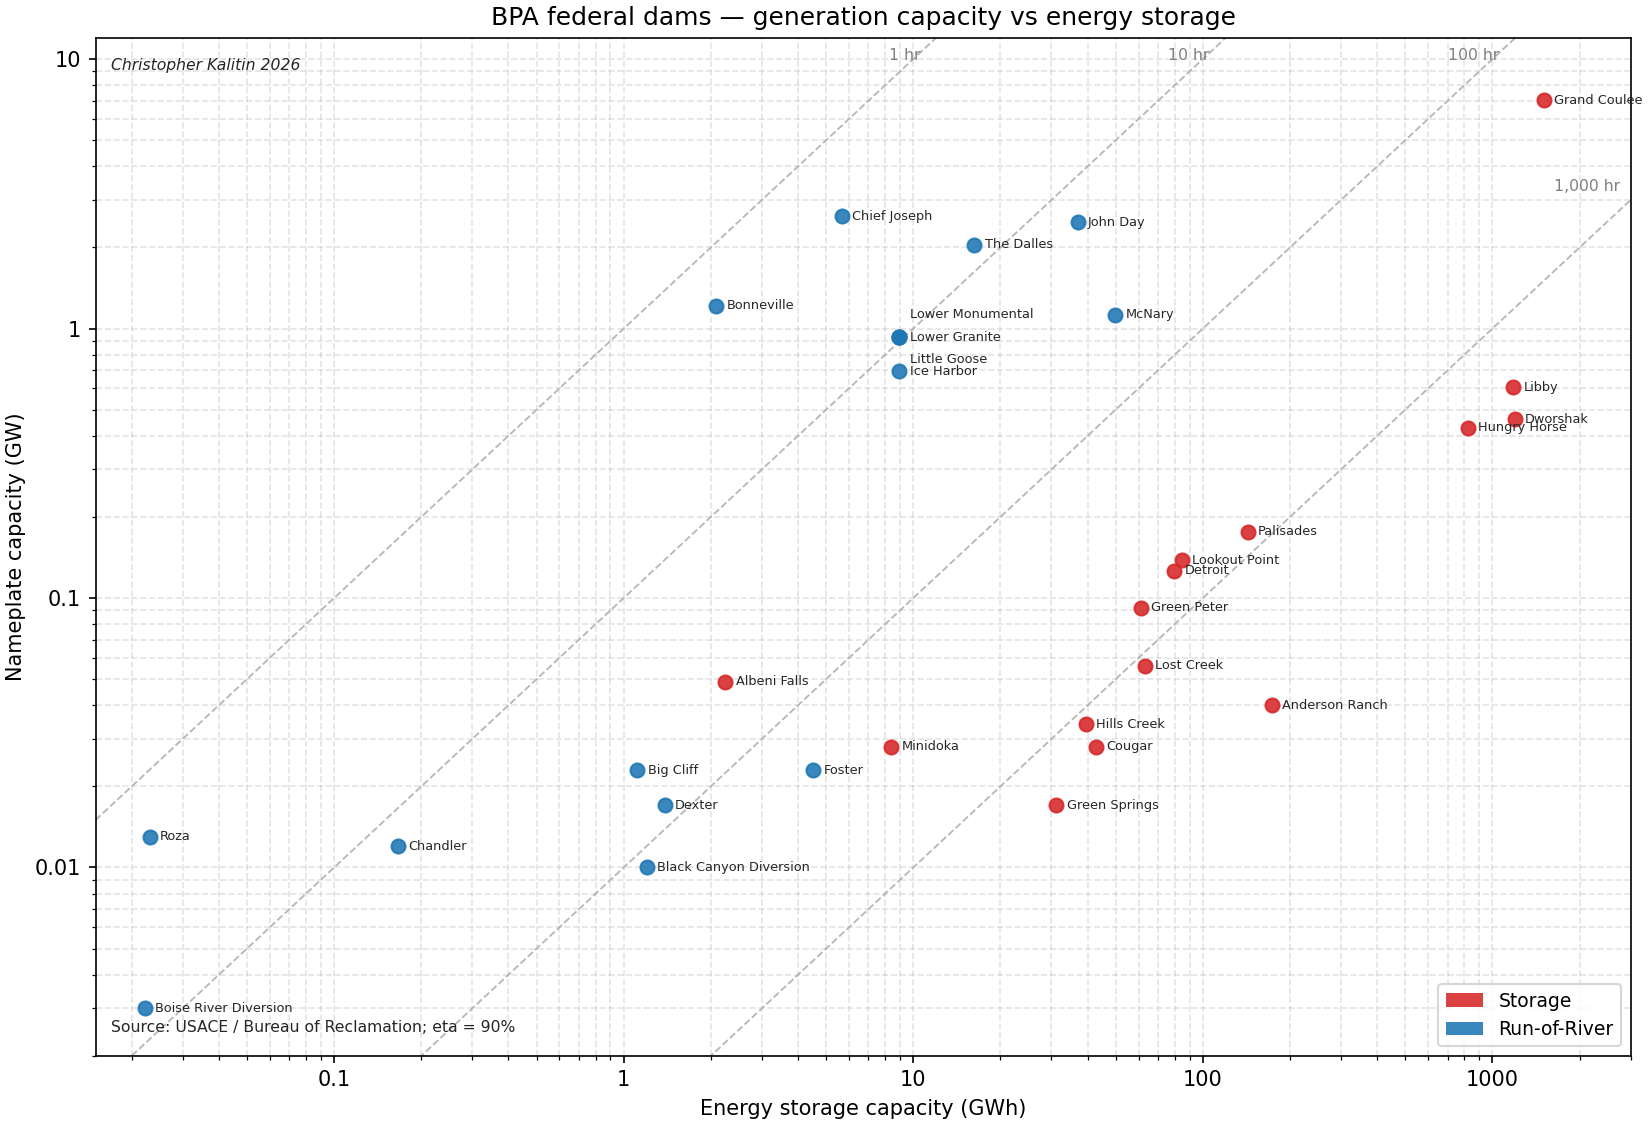
Above is a scatterplot showing all federal dams on the BPA grid with their power generation capacity and the amount of water that is stored in their reservoirs, measured in the energy (if that water was put through the turbines). These federal dams have easily accessible hourly power data, and account for ~70% of dams in the region.
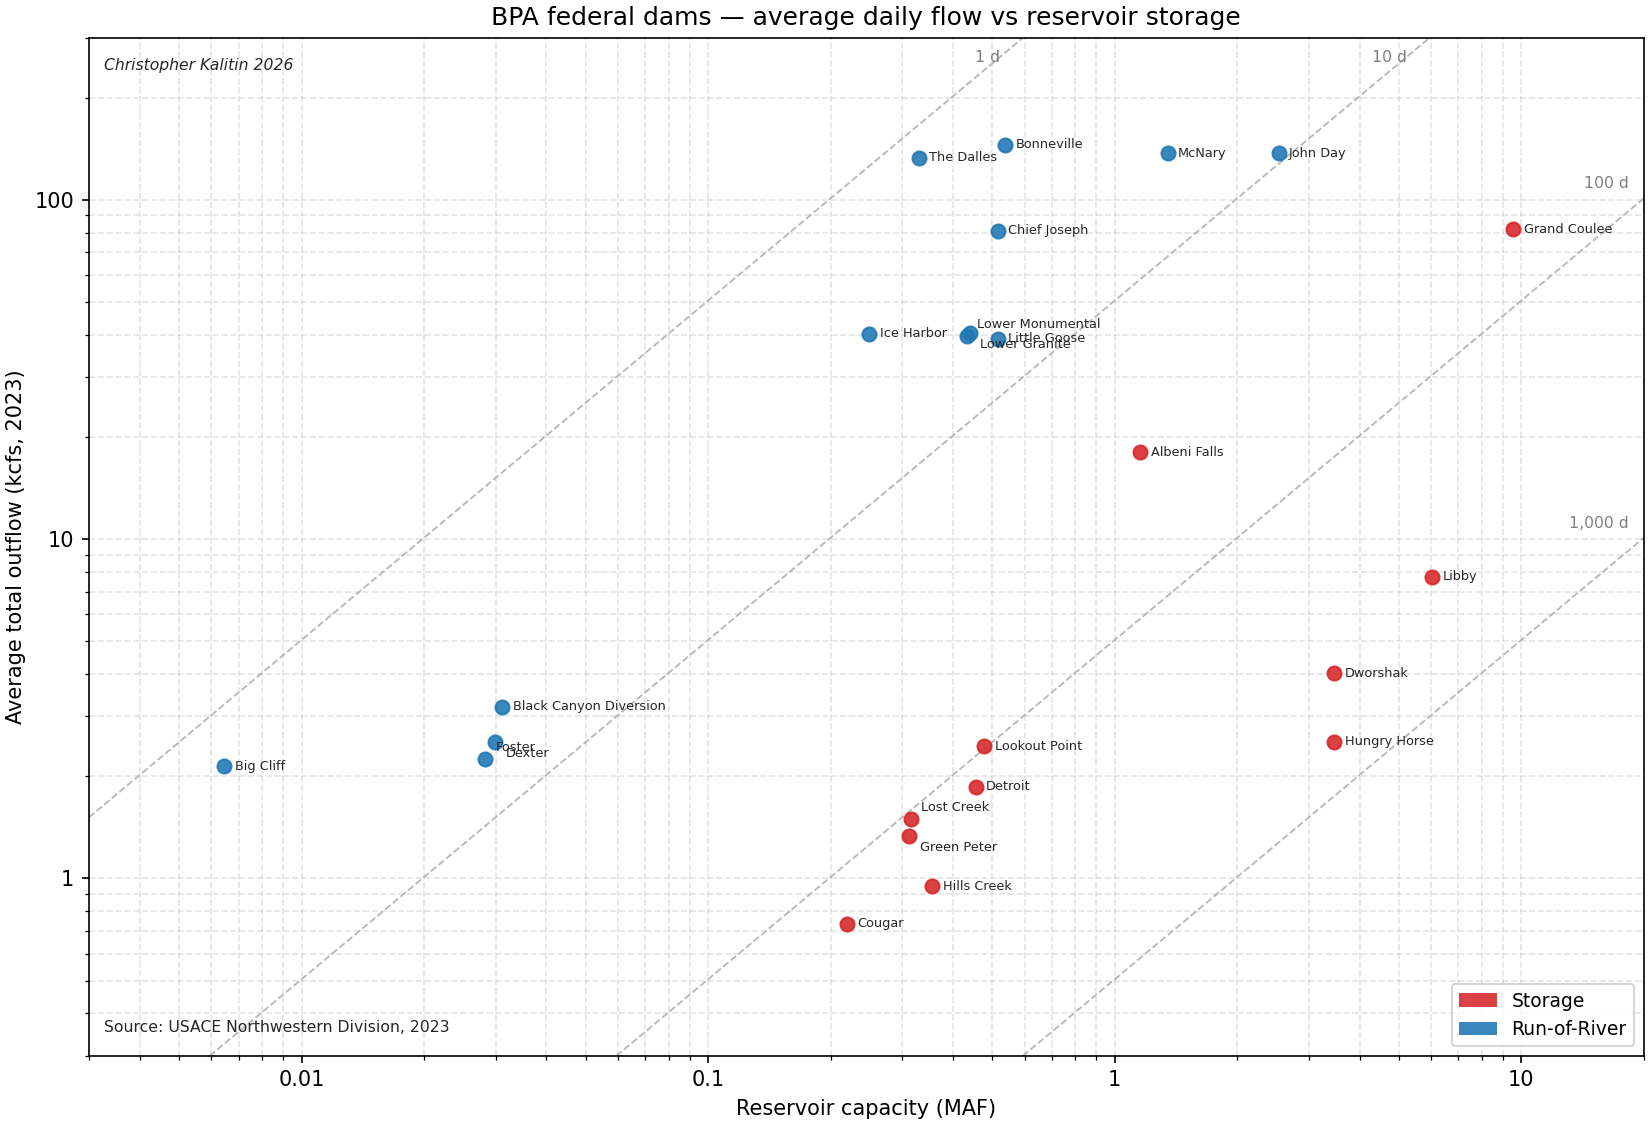
I defined the line between run-of-river and reservoir storage dams as dams that have greater than or less than 10 days of water storage, an impoundment ratio of 0.1. The chart above shows raw water flow and water storage capability of each dam, by which we derive the impoundment ratio.
Run-of-River vs Reservoir Storage Dams
First we notice that there are two primary types of hydroelectric installations, run-of-river dams and reservoir storage dams.
Run-of-river dams have very low storage capacity relative to their power output. These are not dams that resemble the Hoover Dam and create a huge reservoir behind them. Rather, they have only a few dozen feet of reservoir height behind them and a water residence time of hours to days.
In contrast, storage dams have reservoirs that can store thousands of hours worth of power.
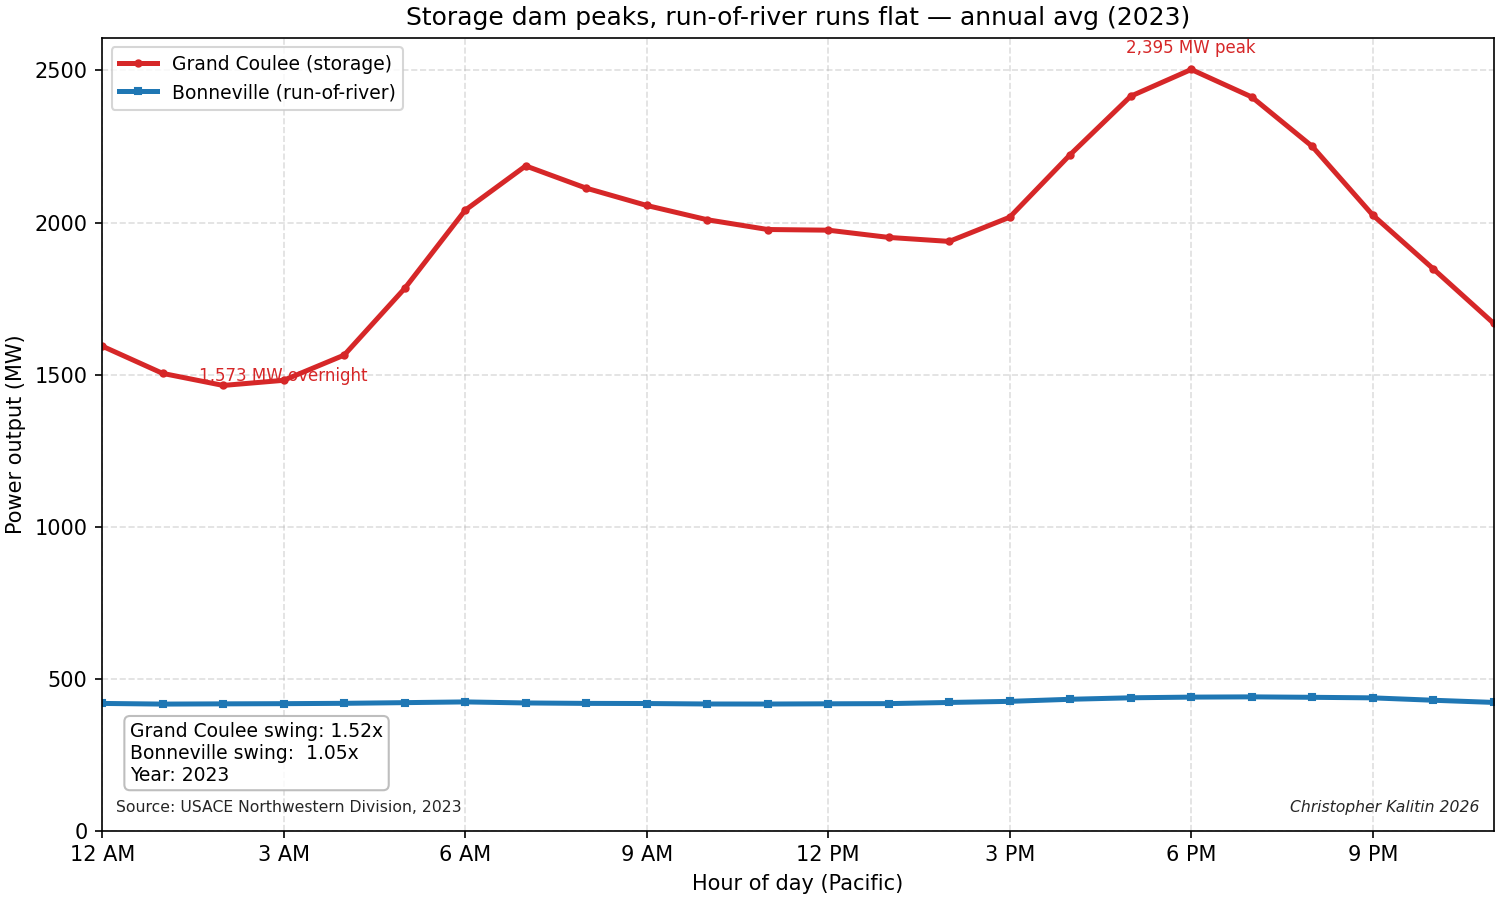
These two types of dams serve very different roles on the grid. Run-of-river dams are base load power generation that does not get metered intra-day or seasonally. Storage dams however can meter their power generation within a single day to satisfy hourly changes in power demand, hence satisfying the duck-curve like effects where power demand peaks in the evening.
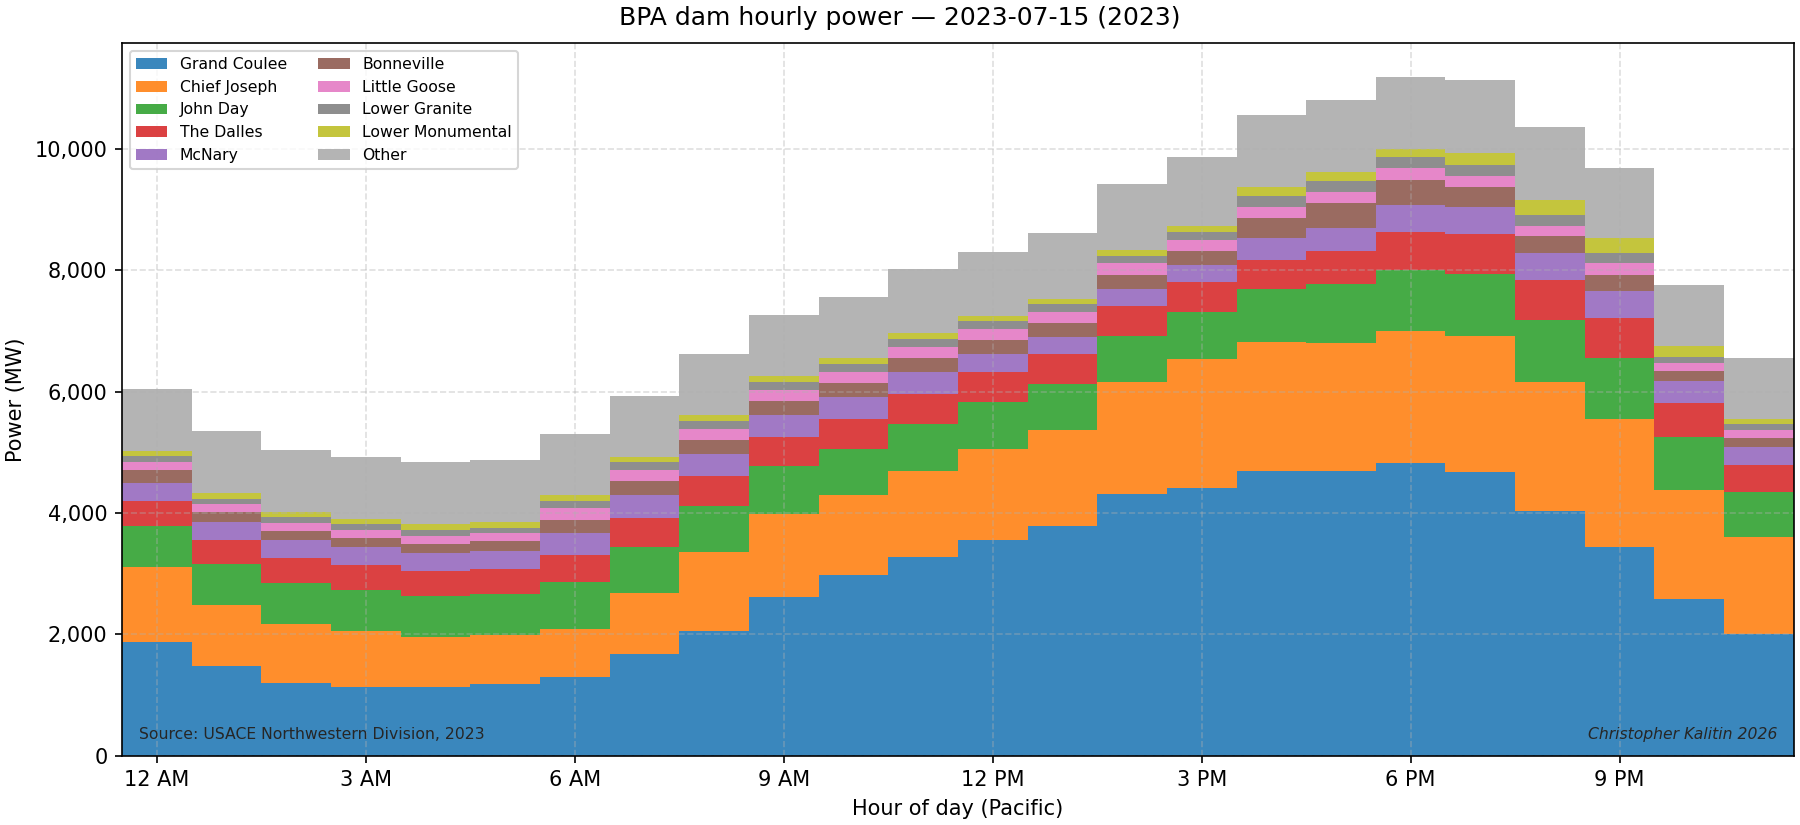
The graph above shows power generation by all the federal dams in the BPA region on the most imbalanced day in 2023. Notice the Grand Coulee dam scales production ~5x during the day (storage dam), while others like the John Day dam stay roughly constant (run-of-river).
This graph further illustrates the point.
Dams Exhibit Low Capacity & Load Factor
The promise of integrating a battery with a hydro power plant is increasing capacity factor. Capacity factor is the nameplate capacity of a power plant over its average utilization. For example, the Grand Coulee dam has a nameplate capacity of ~7 GW but averages closer to 2 GW throughout the year, leading to a capacity factor of 28.8%.
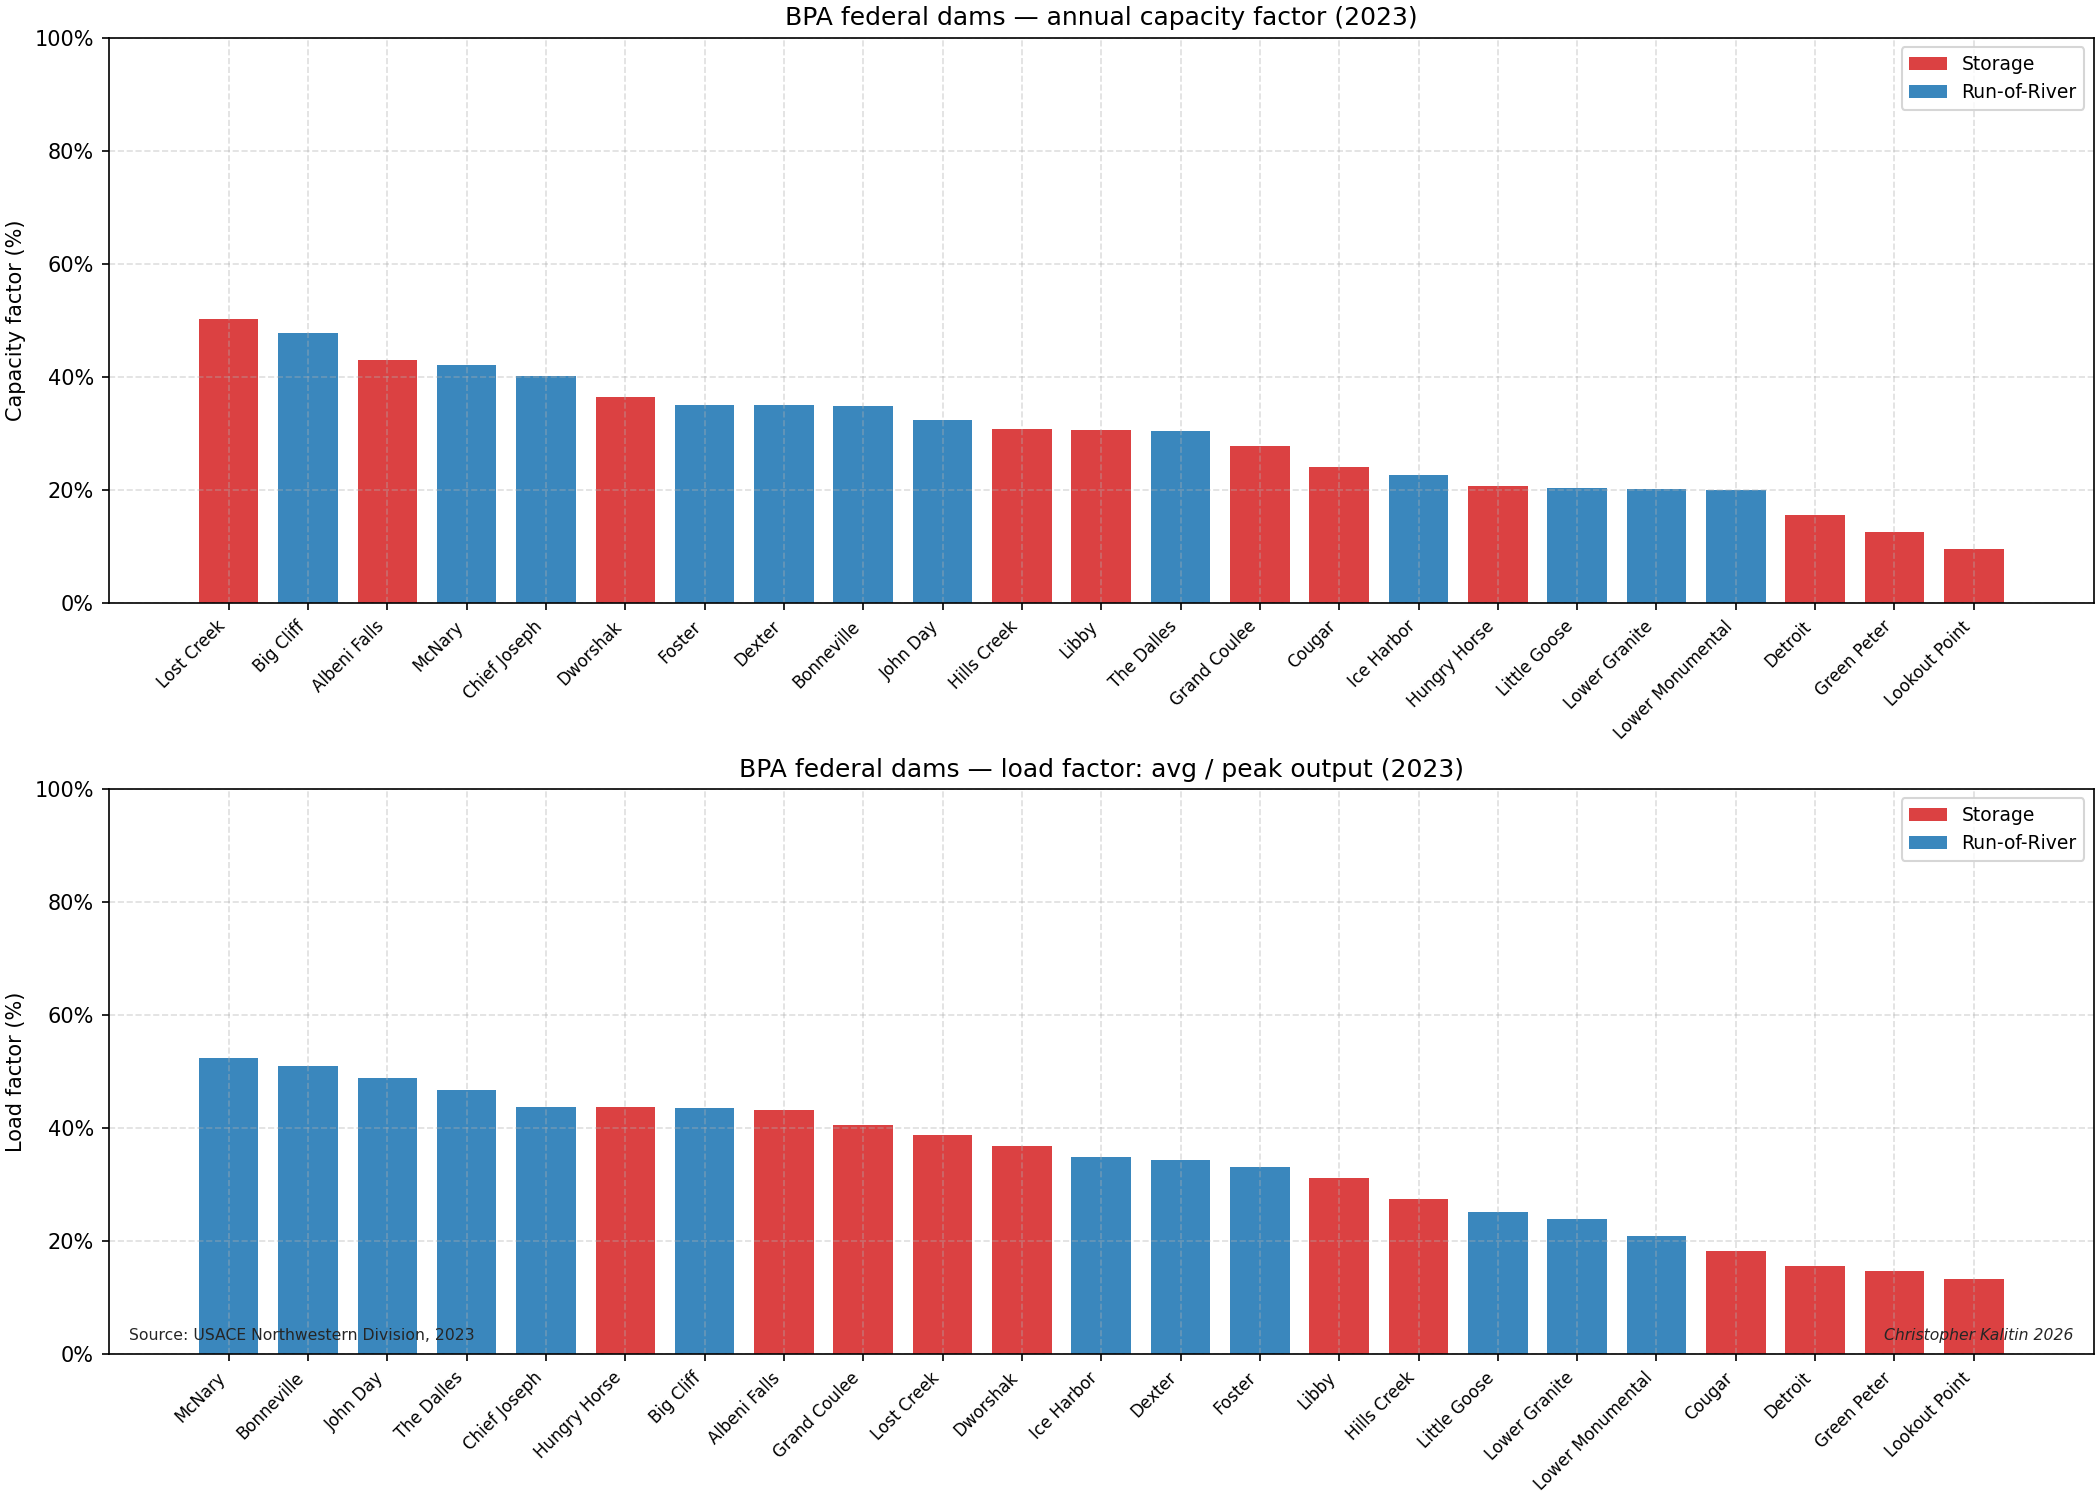
The graph above shows capacity and load factor for all federal dams administered by the Bonneville Power Authority (BPA).
Here we introduce a new term, load factor. Load factor is equivalent to capacity factor except our numerator is the highest achieved capacity, not nameplate capacity. For example, the Grand Coulee dam’s nameplate capacity is 7 GW but in 2023 its max power was only 4.8 GW. This yields a greater load factor than the Grand Coulee’s capacity factor (40.6% vs 28.8%).
Such low load factor suggests that many dams are overbuilt for the utilization they actually see, more on this later.
The Goal Is To Decrease System Cost
Dams are a special case for battery colocation in contrast to natural gas turbines because there is a finite flow of water through a dam.
You cannot arbitrarily increase power output by increasing capacity factor like you could for a natural gas turbine because you cannot supply more water. You can however supply more gas to a natural gas power plant.
So, the optimization looks slightly different for colocating batteries with dams vs natural gas power plants.
With natural gas power plants you can colocate a battery and purchase more natural gas to increase the power available on the grid.
With dams you cannot increase the amount of water that goes through them, within reason. So, instead, colocating batteries is a mechanism by which you can decrease the net cost of an installation, instead of increasing total power available on the grid.
Grand Coulee Dam Case Study
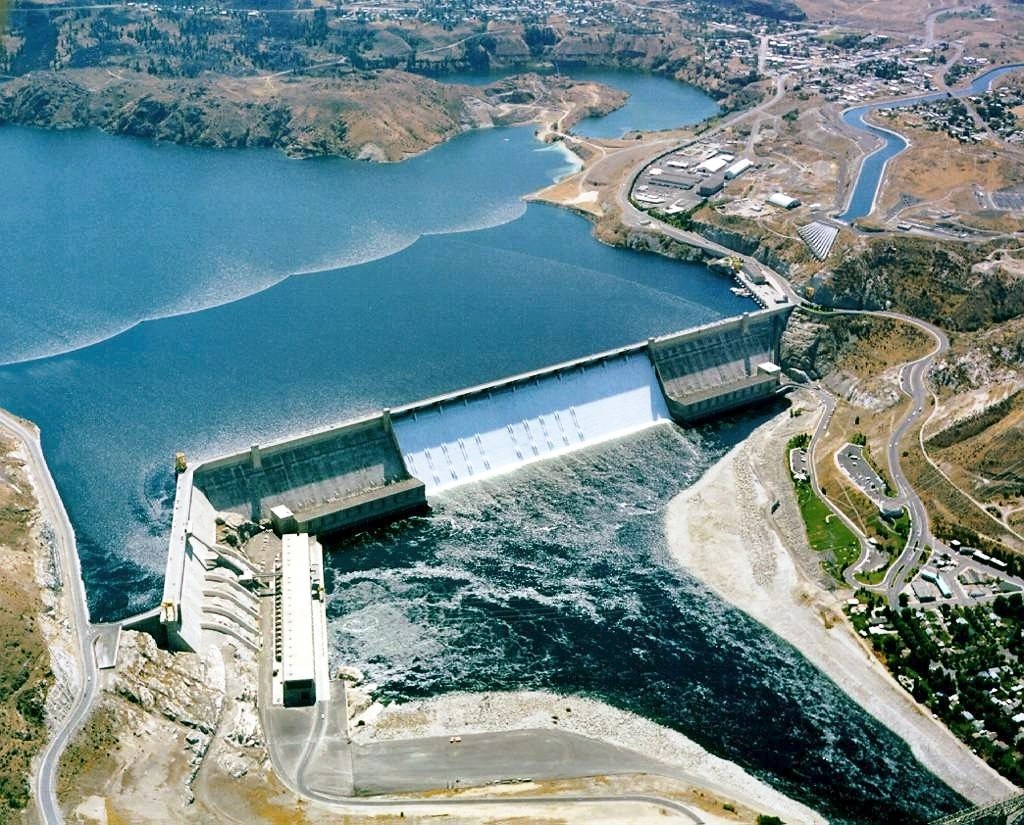
To illustrate our new understanding of Hydro on the BPA grid, we’ll use the Grand Coulee dam to illustrate. This is the biggest dam in America and was built by Henry Kaiser and the six companies between 1933 and 1942.
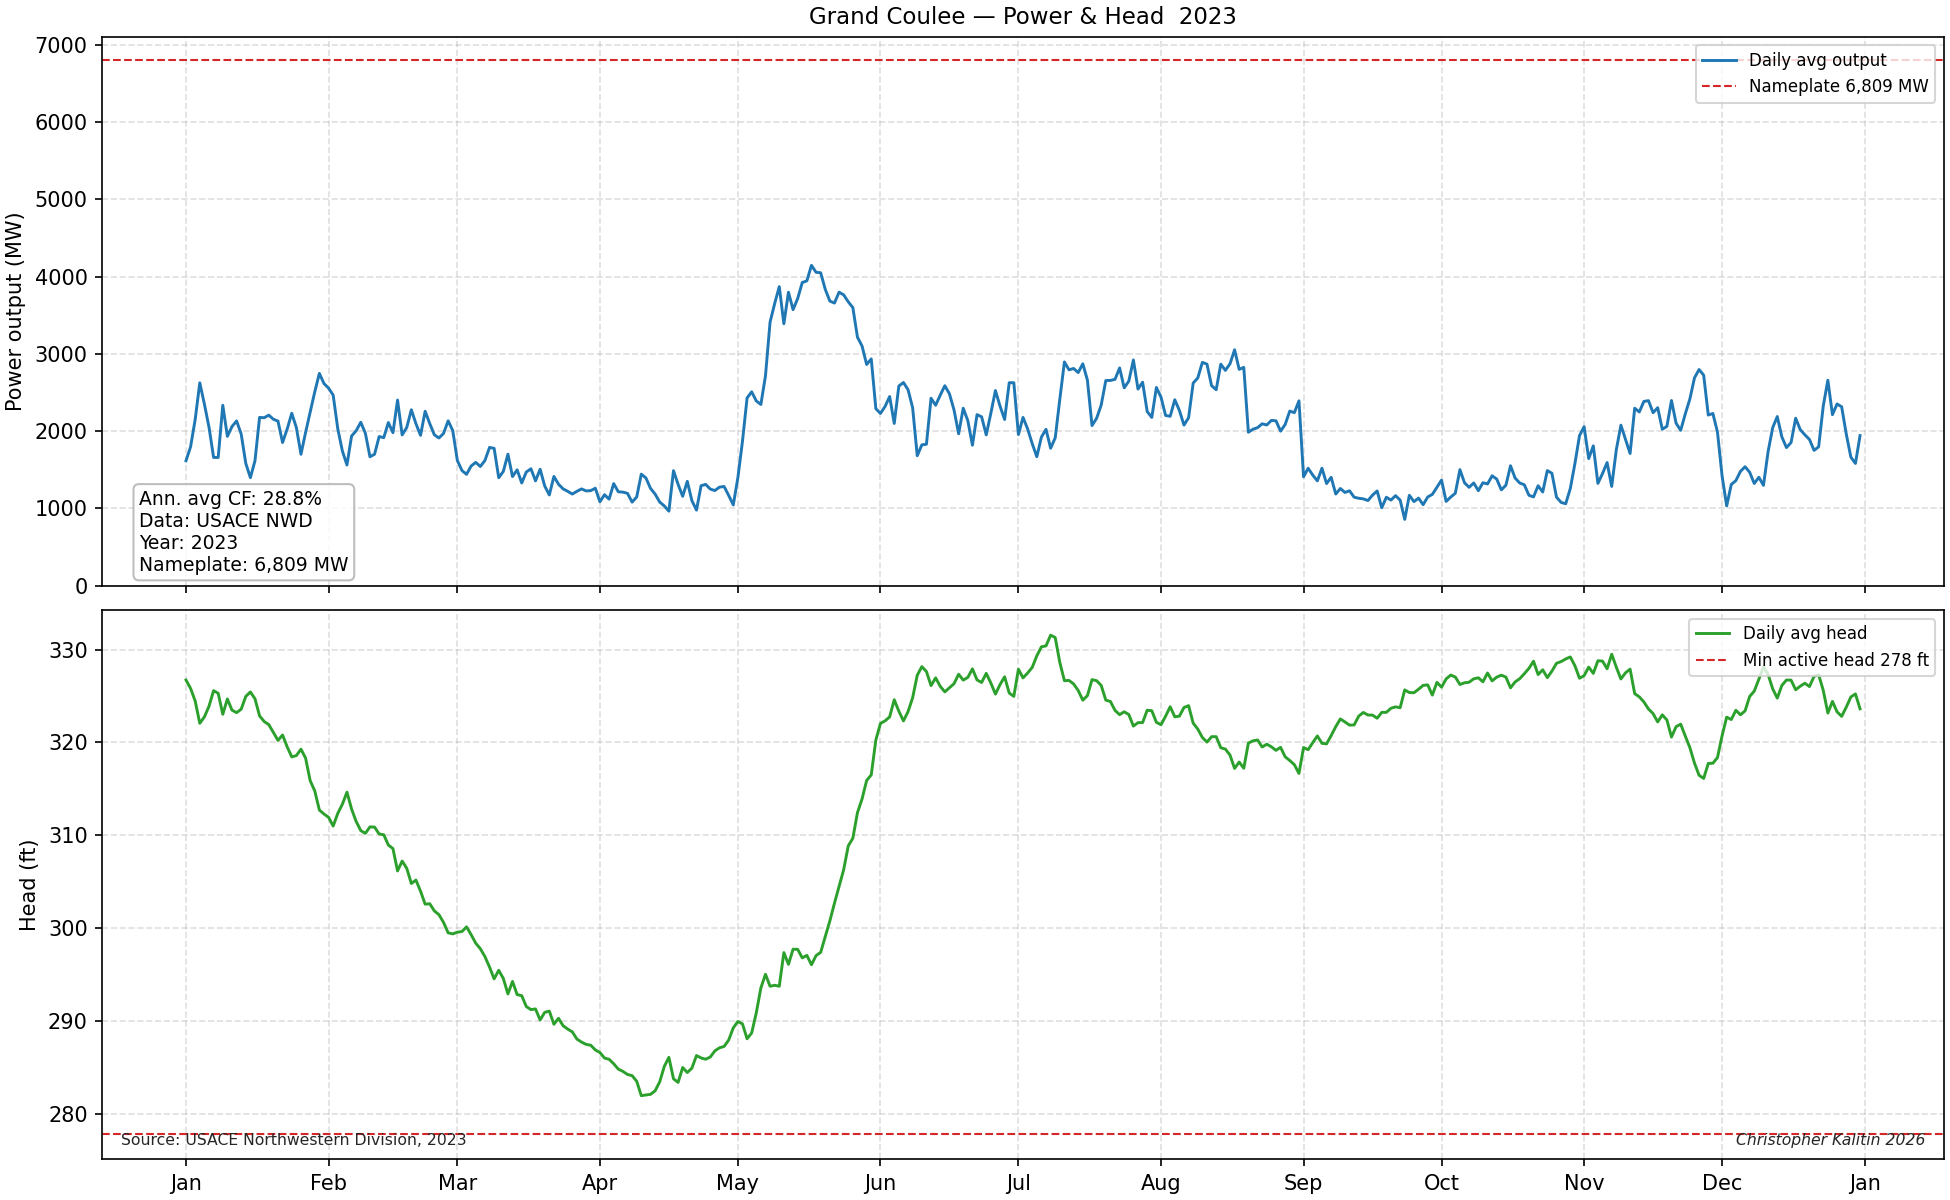
Above is the daily average power output of the Grand Coulee dam and the water head behind the dam over time.
We notice that the Grand Coulee seems to be oversized ~2x. Originally, the Grand Coulee had two powerhouses sized for 2 GW. During the late 70s, a third power house was added that boosted power capacity of the dam to 6.8 GW. This was meant to address projected load growth due to Aluminum refining in the region and 7% year-over-year demand growth for electricity. Aluminum refining moved overseas and we dropped off the Henry Adams curve, so now the Grand Coulee dam serves primarily as a load smoothing installation. Because of its extremely high generation capacity, it has the ability to ramp many gigawatts throughout the day.
Other behaviour we see on the charts above is the seasonal nature of the dam. During the spring its reservoir, the Franklin D. Roosevelt Lake, is drawn down to reduce risk of flooding. Then, between May and June snowmelt greatly increases the water level of the reservoir.
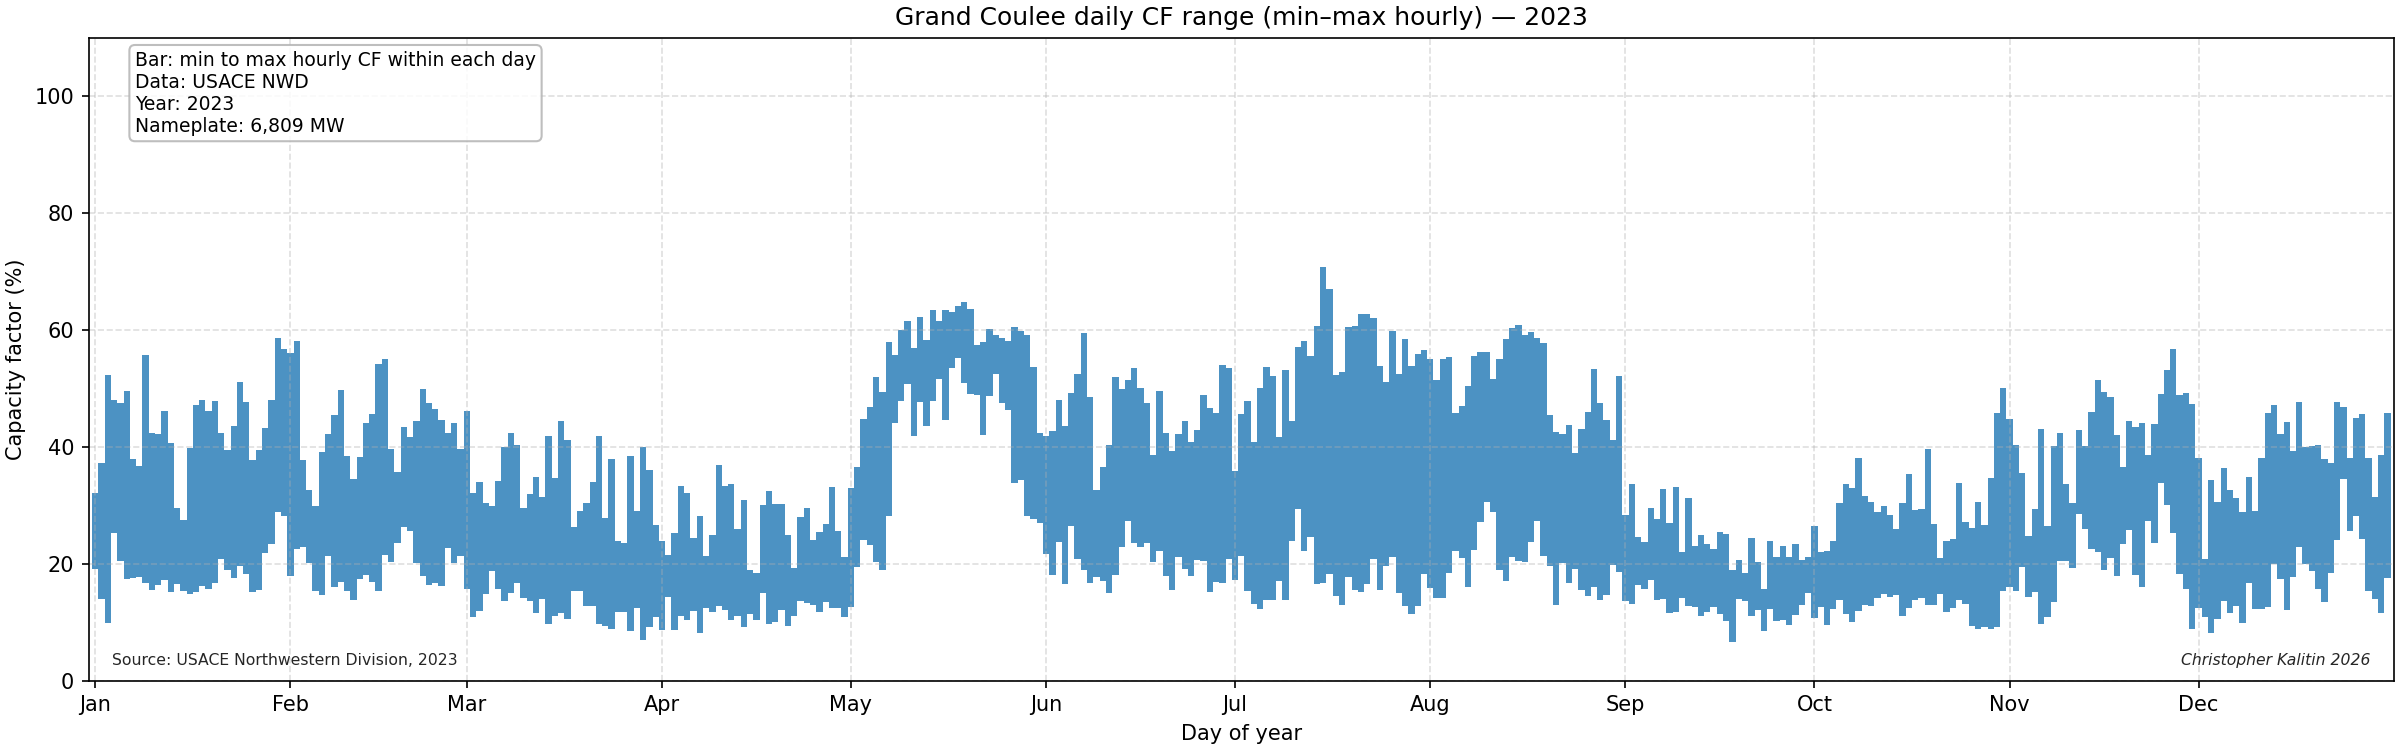
Next we plot the daily capacity factor range of the Grand Coulee dam over 2023. This allows us to get a sense of both capacity factor and load factor. Low load factor percentage is expressed on this graph as a long span between the maximum and minimum capacity factor on a given day.
For example, in the May snowmelt runoff period we see the dam has very high load factor (~50% +/- 10%, load factor of ~66%) while during the summer it has very low load factor (40% +/- 20%, load factor of ~33%).
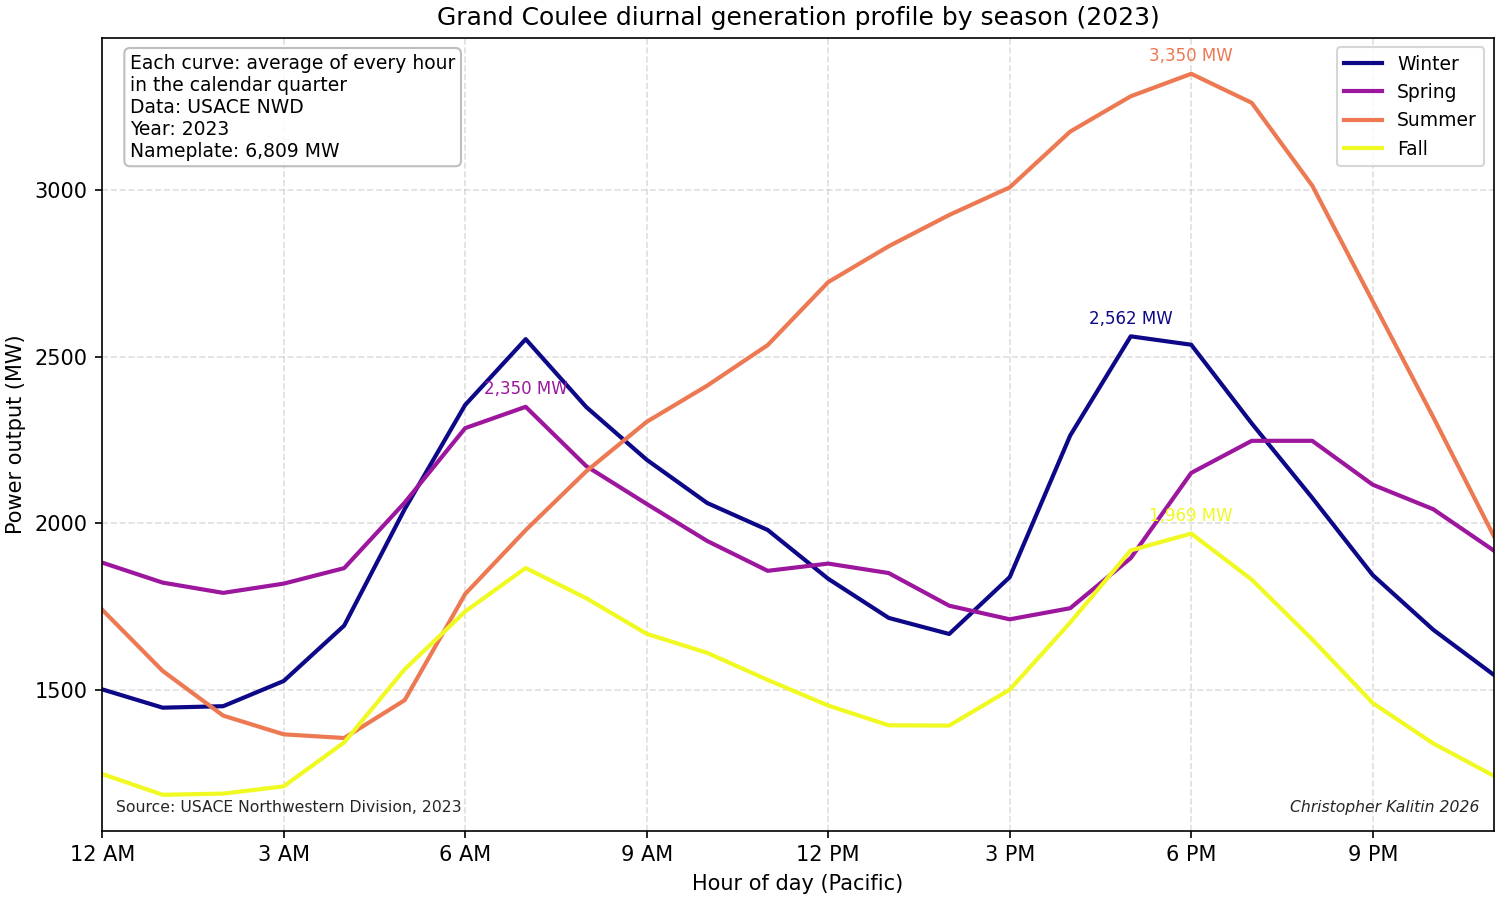
To further illustrate the daily range of capacity factors, the graph above shows the average daily profile during each calendar quarter of the year. We see semidiurnal (two daily peaks) behaviour in all seasons of the year except summer.
This begins to show the opportunity colocating a battery brings. We can decrease turbine capacity to be the middle point between the high and low capacity factors (eg. ~40%, ~2-2.5 GW) and use batteries to make up for the intra-day hourly changes in load.
By this method, we’re trading the cost of the hydro turbines for the cost of the batteries. In a future section we’ll put hard numbers on this tradeoff.
Quantitatively Modelling Cost of Turbines vs Batteries
Finally, we can run the quantitative trades to see if it makes monetary sense to trade off dam turbine capacity for battery storage capacity.
I implemented a naive control algorithm and back fit to the reservoir head and power information I previously scraped from the US Army Corps of Engineers website.
The input to the control algorithm is the historic power output of the dam on a given day. The historic power output is what we set as the load profile we must meet. Through this method, we’re replicating the exact profile of a dam on the BPA grid. If a given dam has a large reservoir and is used for load smoothing, we replicate that functionality. If it’s a run-of-river dam, we replicate that functionality as well.
With the historic power output, we set a daily budget of water that is allowed to travel through the turbine. The control algorithm then passes water whenever required to serve load and to charge the battery. It uses as much as possible. Then, at the end of the day it has used its daily budget of water and the batteries handle the rest.
This method doesn’t fully capture the realm of controls that can be implemented in a Hydro storage + battery storage system, but alas life is short and I deemed it sufficient for this analysis.
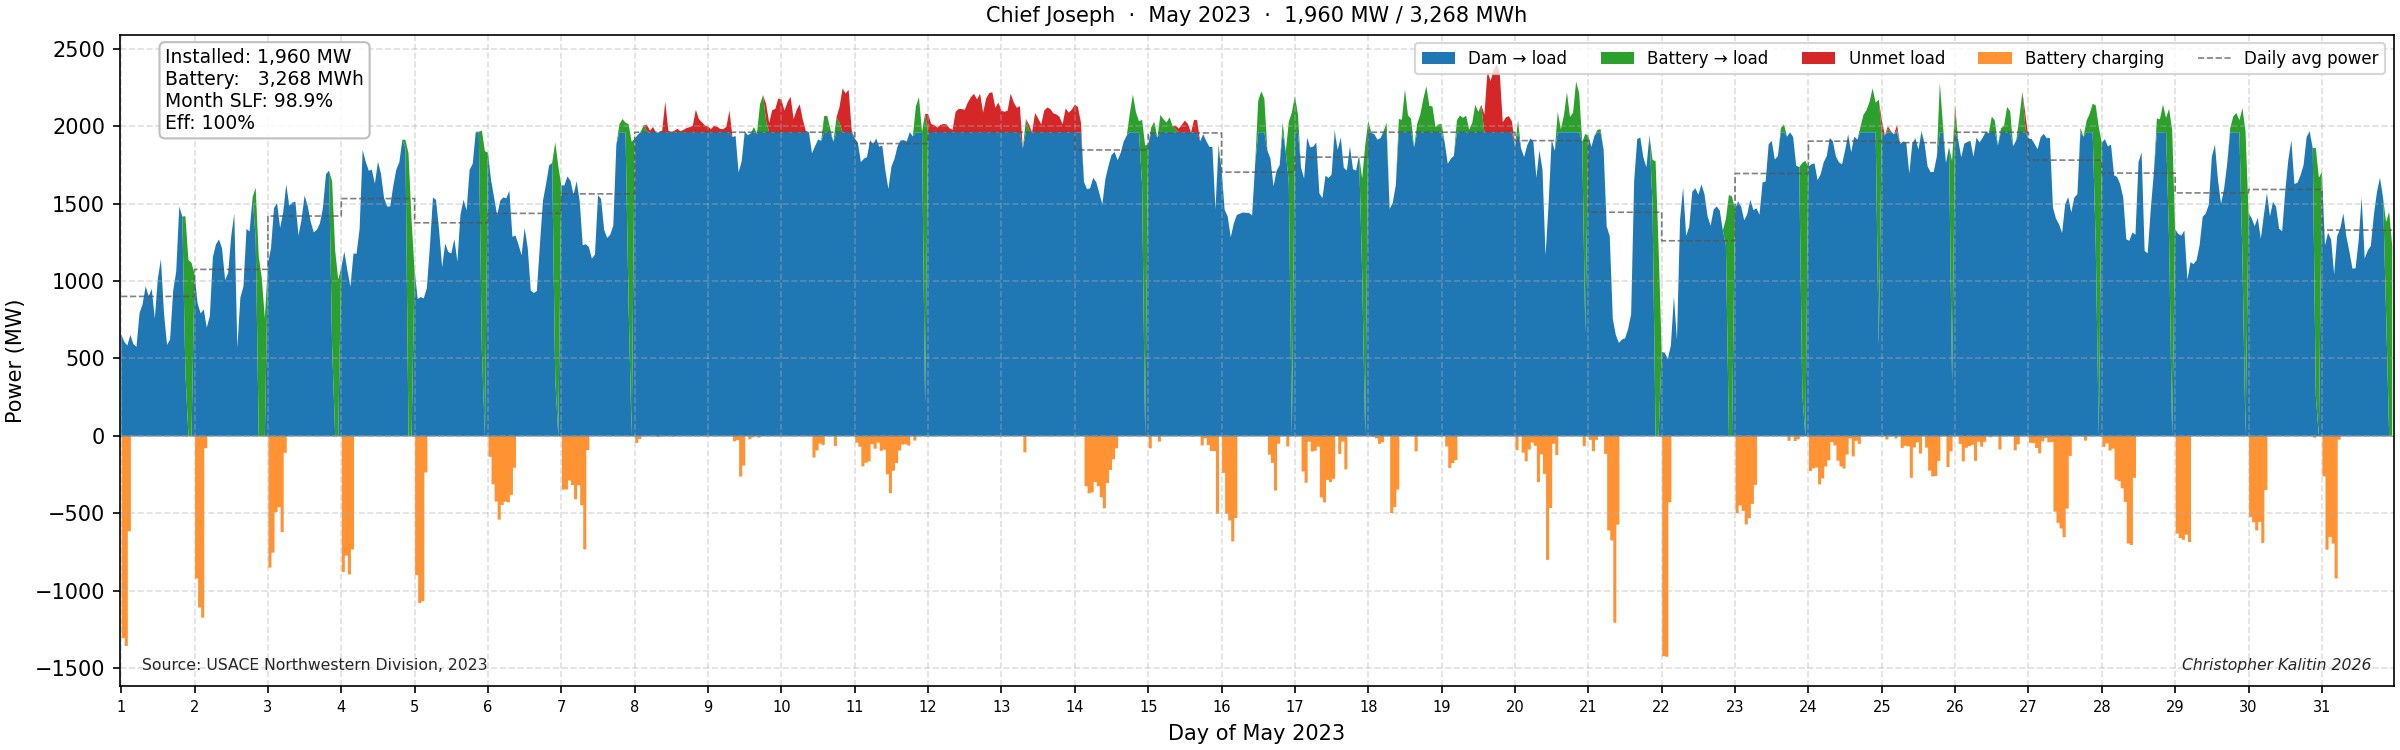
I used the Chief Joseph dam as a representative example of a reservoir storage dam on the BPA grid. As a reminder, run-of-river dams aren’t particularly suitable for battery storage as they’re used for supplying base load generation.
Above is a graph that shows the output of the control algorithm in May for a 1,960 MW turbine and 3,268 MWh battery. In reality, Chief Joseph has a 2,620 MW turbine. We notice some unserved load on highest production days.
This again shows a limitation of the model. Because storage dams operate at peak production in May due to snowmelt, the load our dam is attempting to meet is extremely high. This shows up as unserved load in our model, when in reality it could manifest as spillover, which is energy otherwise going unused, but does not mean your home goes dark.
Nonetheless, this model provides illustrative examples of how we can trade off batteries and turbines. There are quantitative limitations, but we should be directionally correct.
Sweeping Turbine & Battery Installations To Find Minimum Cost
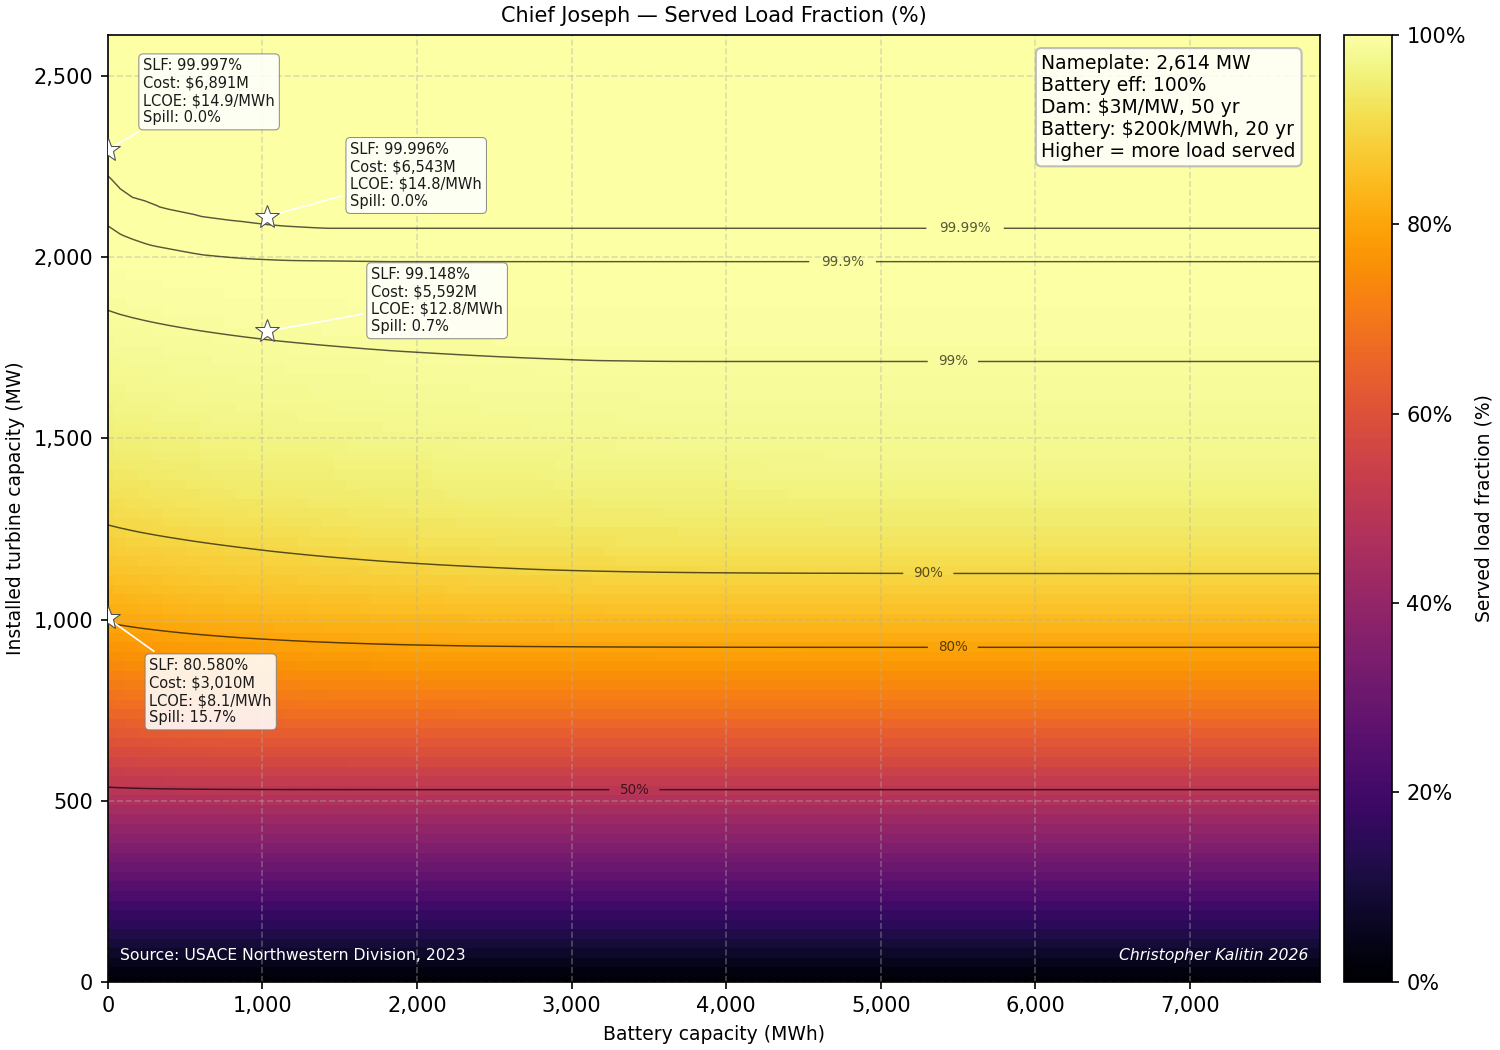
We first sweep installed turbine capacity and battery capacity so that we can find the served load fraction for every combination. Served load fraction is the percentage of the historic load that we serve, as mentioned in the previous section.
We notice that the dominant variable controlling served load fraction is installed turbine capacity. This is an intuitive result because our battery is only capable of hours of storage, so during a particularly bad month like May we just need more turbine capacity.
However, the impact of batteries is not lost. We see that especially at high turbine capacity, the impact of even a relatively small amount of batteries is enough to add extra 9’s to the served load fraction. In the power business, the march of 9’s of reliability is the primary metric that is optimized for, along with cost.
Continuing forward, we need to consider the cost of our combined hydro plus battery system. Simply making the observation that batteries increase served load fraction is not enough, we need to compare the cost of installing batteries versus marginally increasing turbine capacity.
Above we see that the slope of the cost contour lines is constant and very much in favour of batteries because they’re much cheaper than turbines. I used $3M/MW for turbines and $200k/MWh for batteries (slightly worse than China and better than Tesla). This means one MW of turbine is worth 5 MWh of batteries.
Total cost of the plant is not the metric we want to define our analysis on. Total cost doesn’t take into consideration the amount of energy generated by a given combination of turbines and batteries. For this, we get the net energy generated and divide it by system cost to get the levelized cost of energy (LCOE) in units of $/kWh.
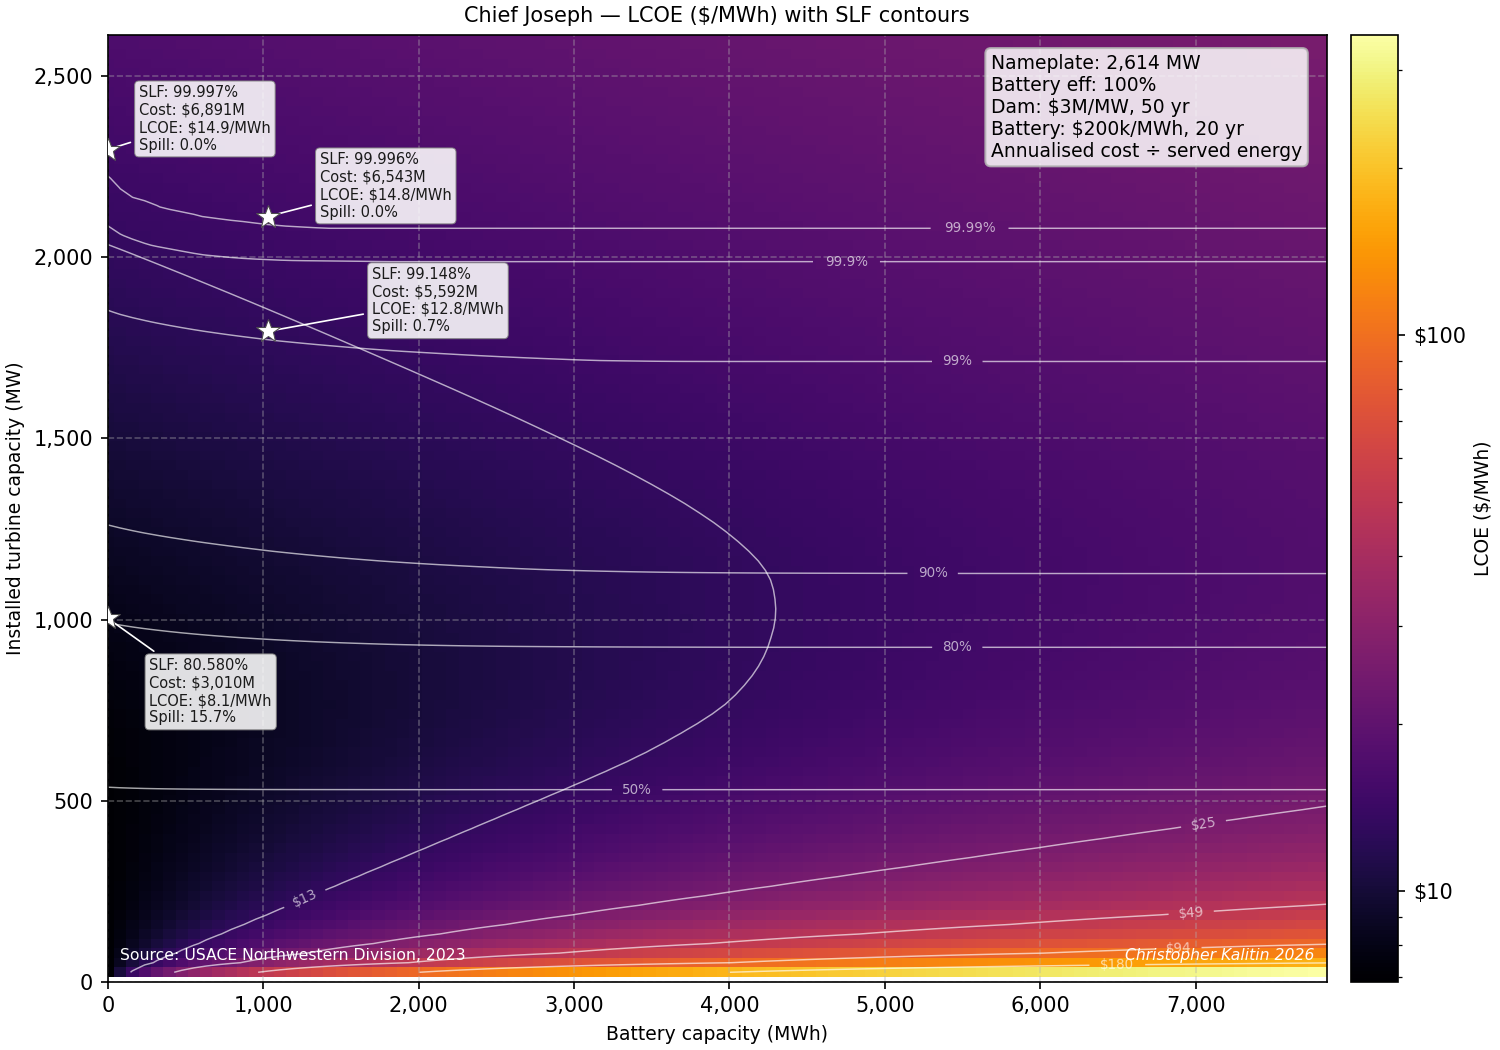
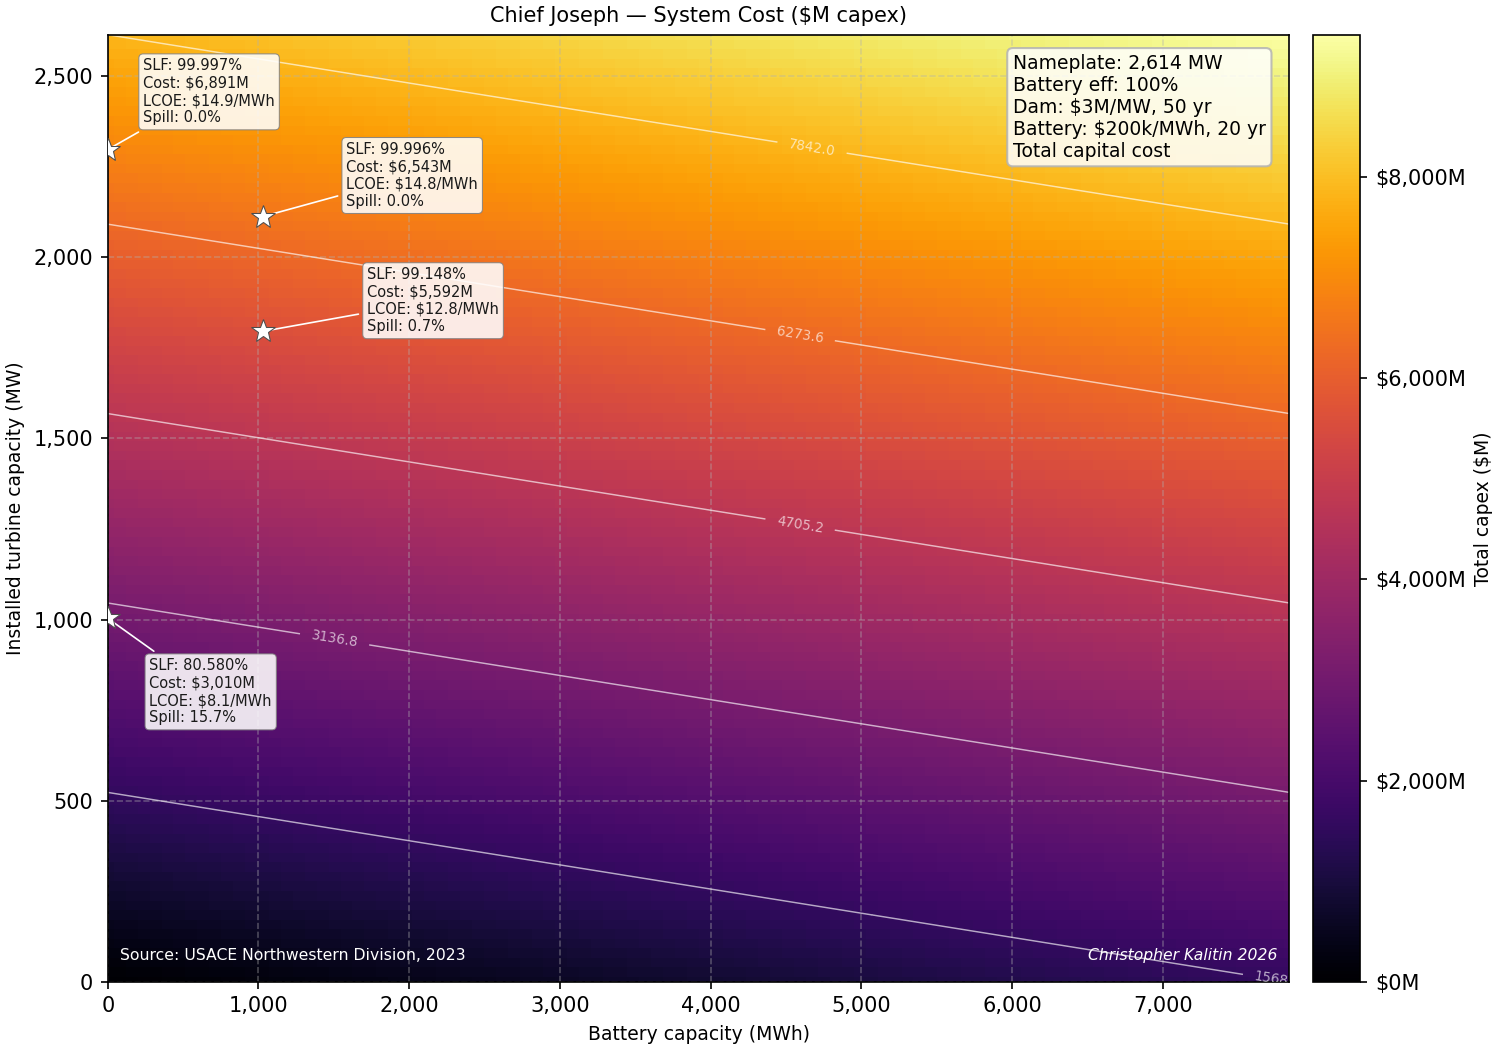
This slightly busy graph is the ultimate output of this analysis. It overlays the contour lines of served load fraction onto a heatmap of LCOE.
With this chart, we can visually see lines that show constant served load fraction (one of our optimizations) on top of the cost at any point on that line (our other optimization).
If we assume we have a strict requirement of >99.99% served load fraction, we can move along the 99.99% contour line until we read the minimum cost point. This happens to be at ~2,100 MW and 1000 MWh for the Chief Joseph dam. This point is only ~1% cheaper than a pure hydro installation, so the batteries aren’t particularly enticing.
However, if we relax our served load fraction to 99% we can decrease our cost - remember in the previous section I showed how the limitations of this model make served load fraction difficult to make 100%.
At 99% served load fraction we have a cost of $12.8 / MWh, as compared to $14.8 / MWh at 99.99%. This is a 15% decrease in cost that we can achieve if the grid can allow this particular Hydro installation to serve 1% less load. A 15% cost savings (partly brought about by battery usage) for a 1% decrease in served load fraction sounds enticing.
Taking this idea to the extreme, we can decrease cost by ~50% if we tolerate 80% served load fraction and less generation capacity.
Dams Are Very Expensive
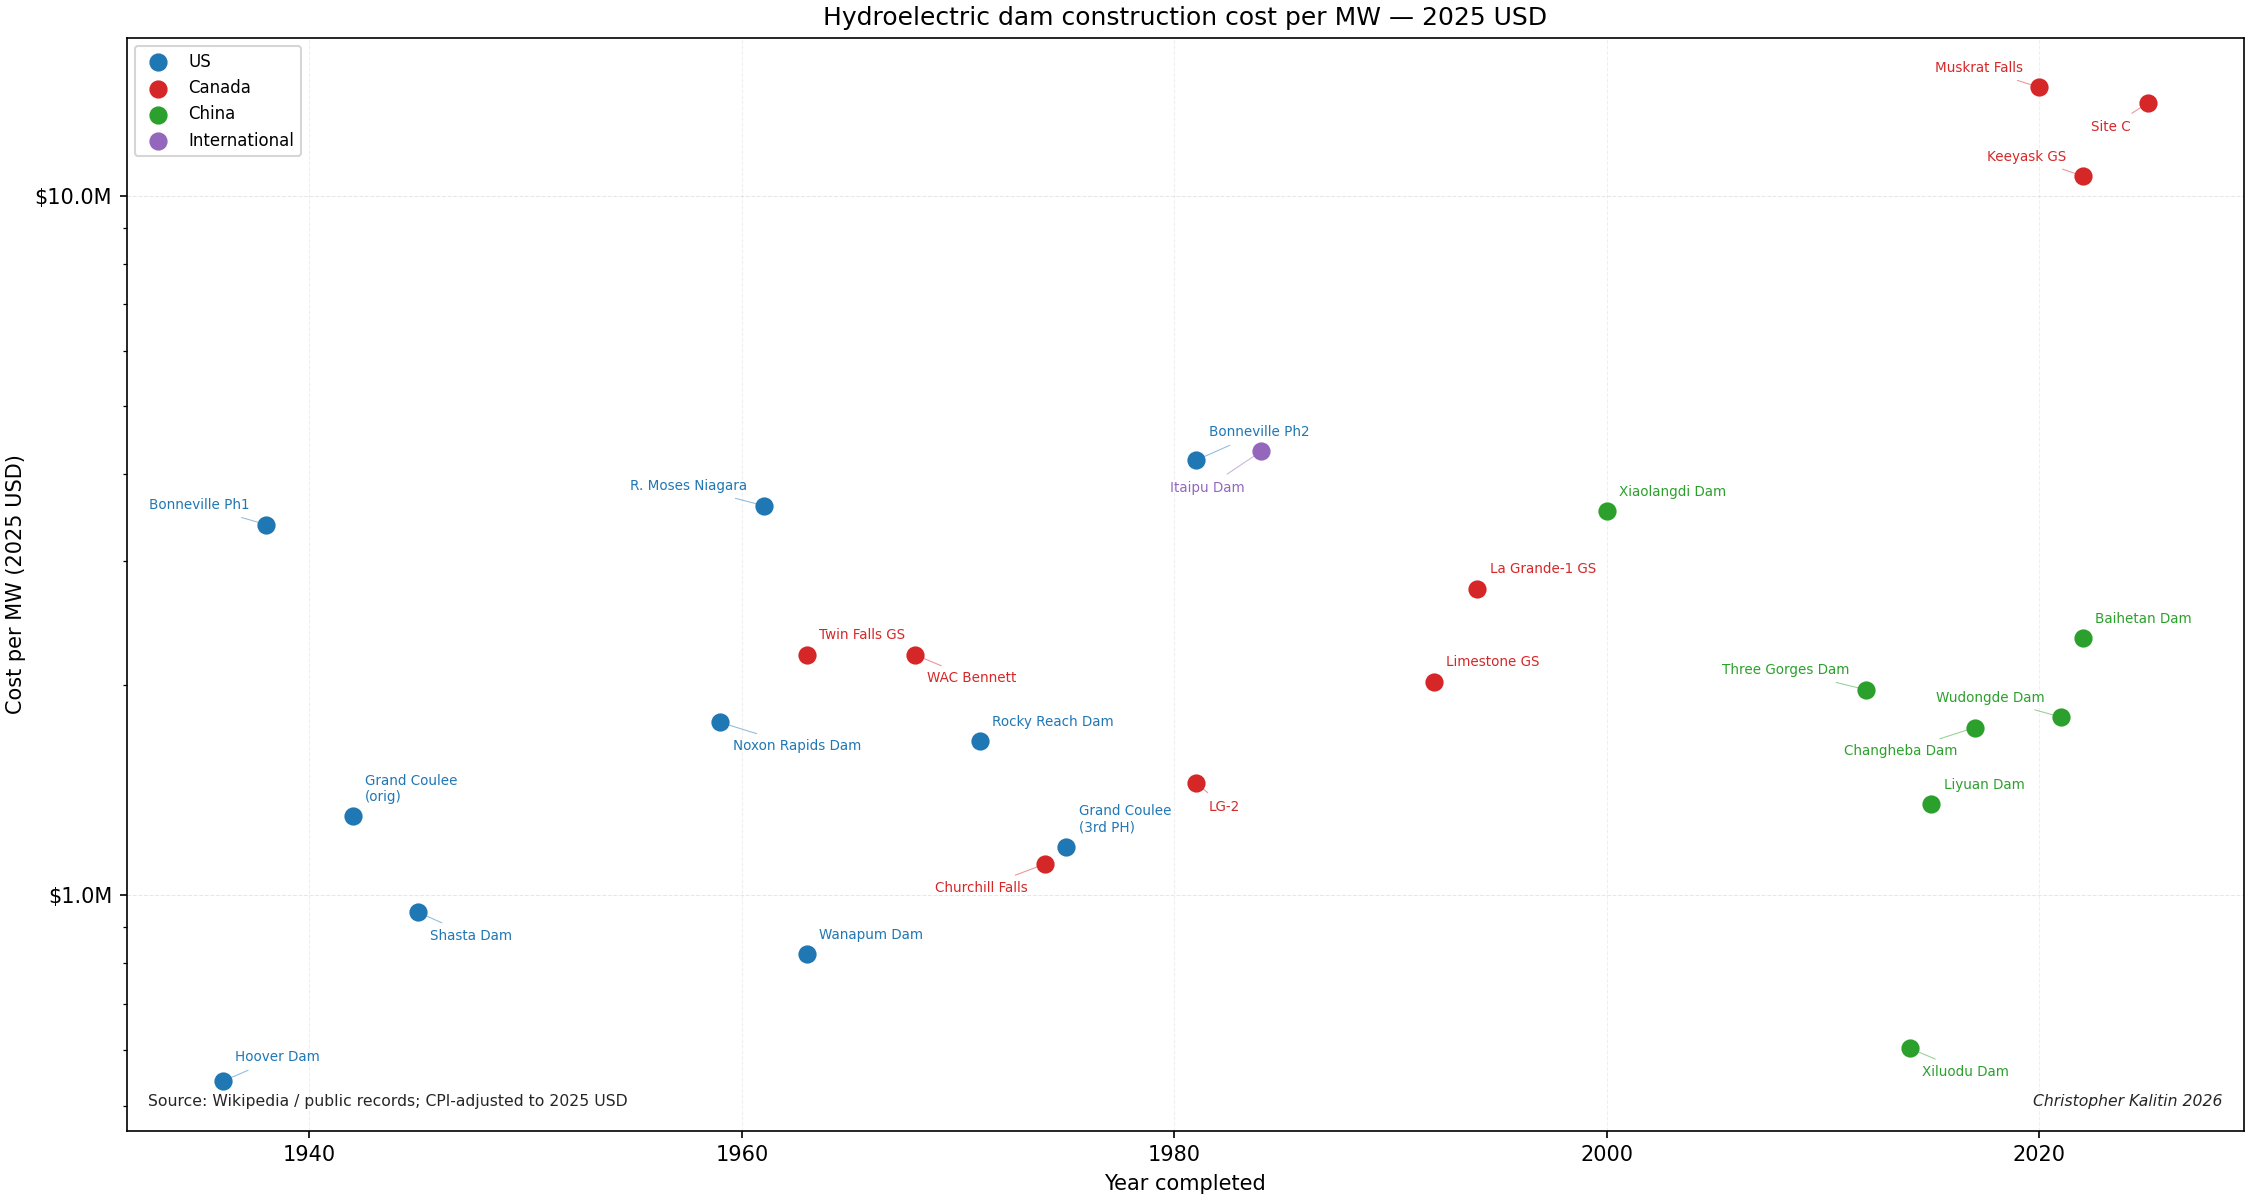
Before coming to any more conclusions, it is best I back up my $3M/MW hydroelectric power figure.
Above is a chart of dam costs around the world over time. We notice that dams have been at roughly the same cost over time. However, dams outside of China have been greatly increasing in cost over time.
Canada has done a horrible job here where the Civil Engineers seem to have completely forgotten how to deliver any project on time or on budget, possibly due to the lawyers and environmental “engineers.” The Site C dam is the worst example of this, which increased in cost ~2x from start to finish.
Had Canada not proven its absolute inability to build hydroelectricity cheaply, we could have stayed with the ~$3M/MW number in this analysis. However, with this new information it’s worth seeing the impact of ~$10M/MW turbines (note that I’m using “turbines” and “hydroelectric plant cost” interchangeably).
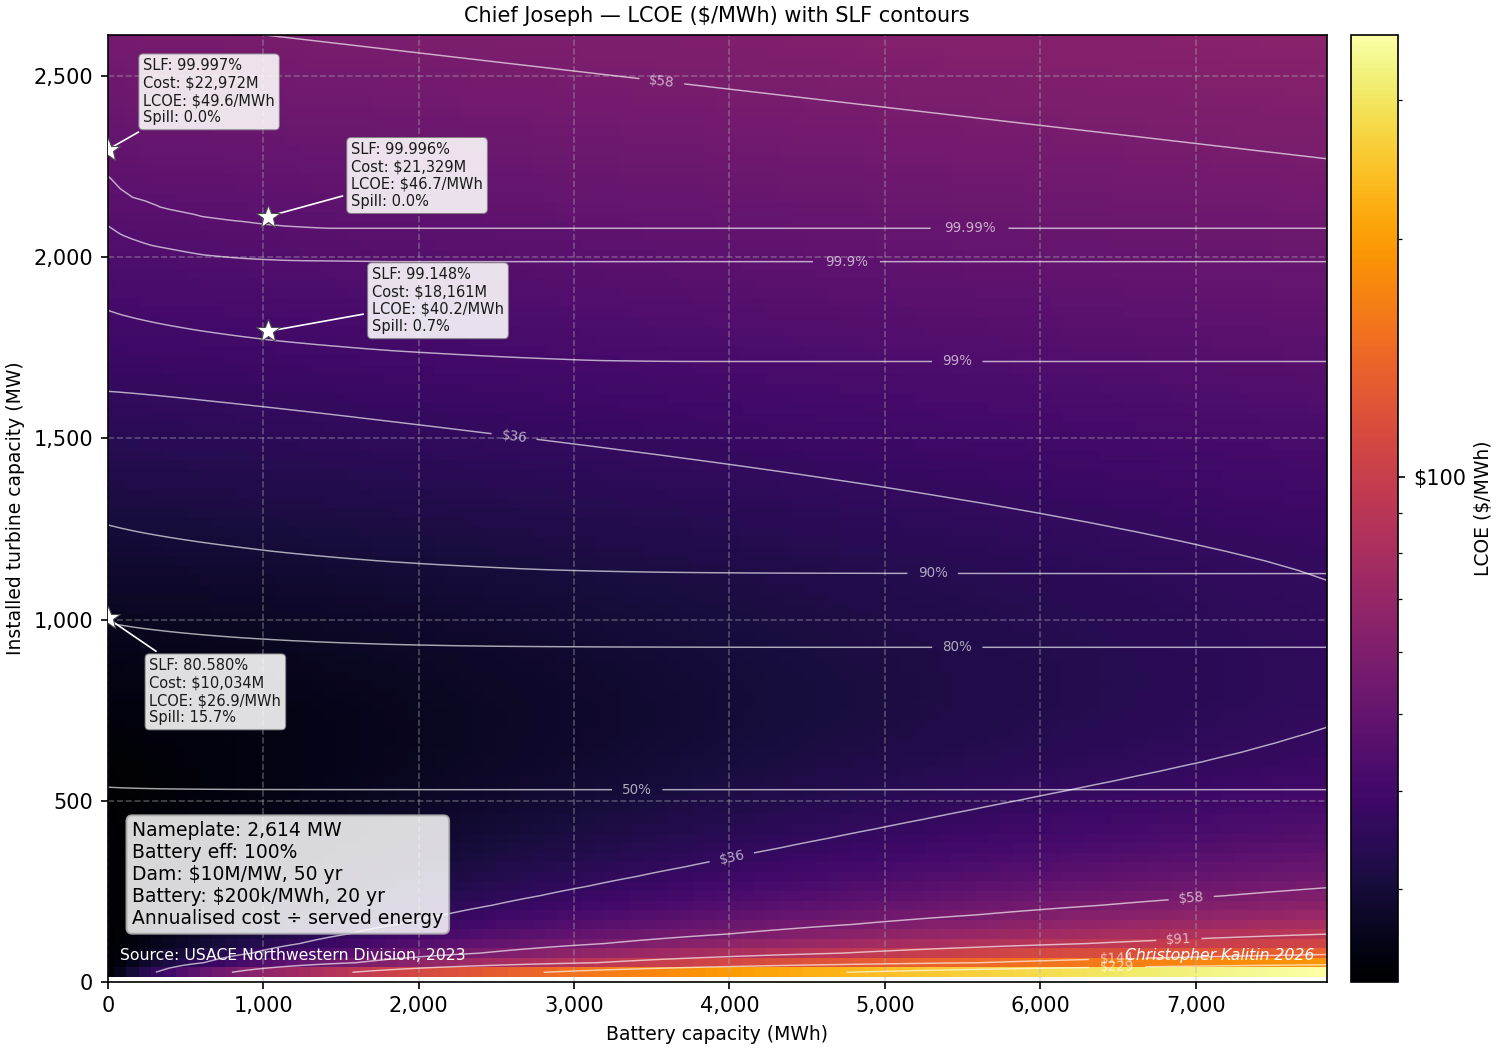
If we use $10M/MW we notice that the relative advantage of batteries increases.
Batteries still only serve as a vehicle by which you can ride a served load factor contour line to a cheaper point. Now the difference is that instead of only eg. a 1% decrease in cost you can get 3%.
Still, decreases in costs due to usage of batteries are dominated by decreases in costs due to lowering turbine capacity.
Closing Insights on Renewables
In the end, we found that batteries can only have a very marginal contribution to decreasing energy cost if we keep the historic load profile of dams.
The fundamental reason for this is that achieving high served load fraction is only possible through increasing turbine capacity. Turbines have the ability to generate power while batteries only have the ability to arbitrage (transfer) power over time.
This necessarily shifts the equilibrium towards turbines if your goal is increasing served load factor.
However, if the goal is instead to decrease the net cost of a system, the optimization is to tolerate lower served load fraction so that you can install less turbine capacity that will only be utilized when water flow is very high (a minority of the time).
This parallels the phenomenon in solar and battery systems where the cheapest LCOE is a system that is purely solar with no batteries. Solar produces energy while batteries only transfer it, so to minimize cost per unit produced energy you optimize for entirely solar if you don’t have high utilization / served load fraction requirements.
In the end we found that for every MW of turbine adding ~0.5 MWh of batteries is ideal for reaching the lowest possible cost. This however only decreases cost by ~1%, so you may as well not bother.
Instead, to properly reap the rewards of battery energy storage you need to either have an extremely expensive dam or change the load profile the dam provides. This entails not just fitting to historic data, but finding a new model for a reservoir storage dam to operate under.
Update: Hydro + Battery Grid From The Ground Up
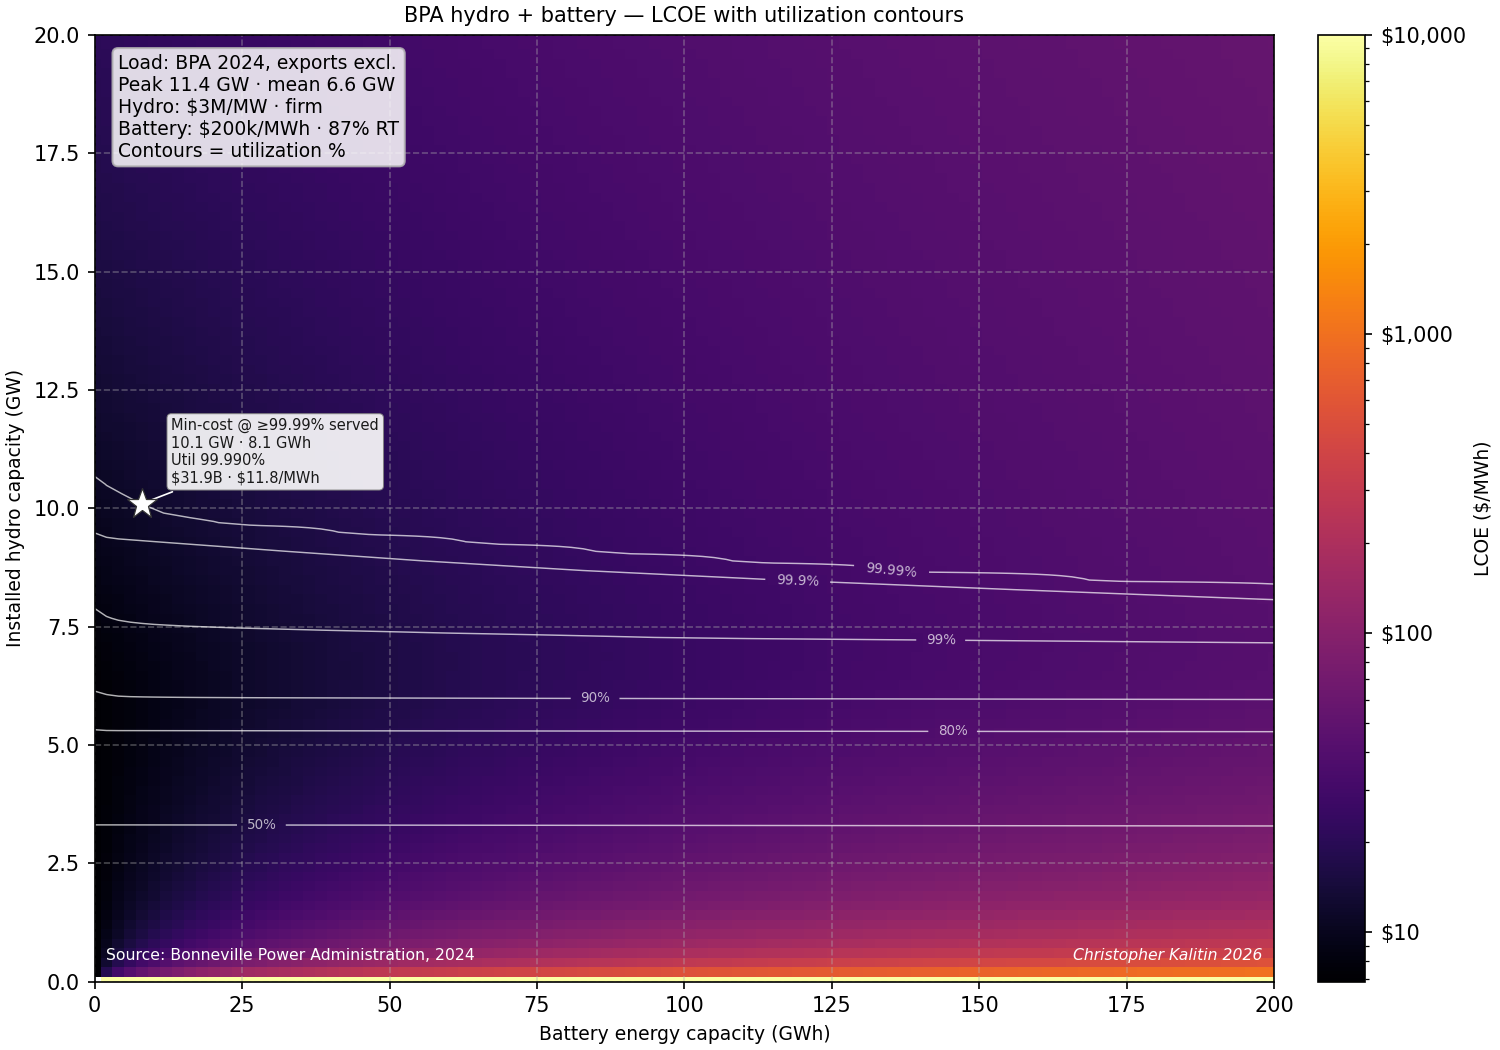
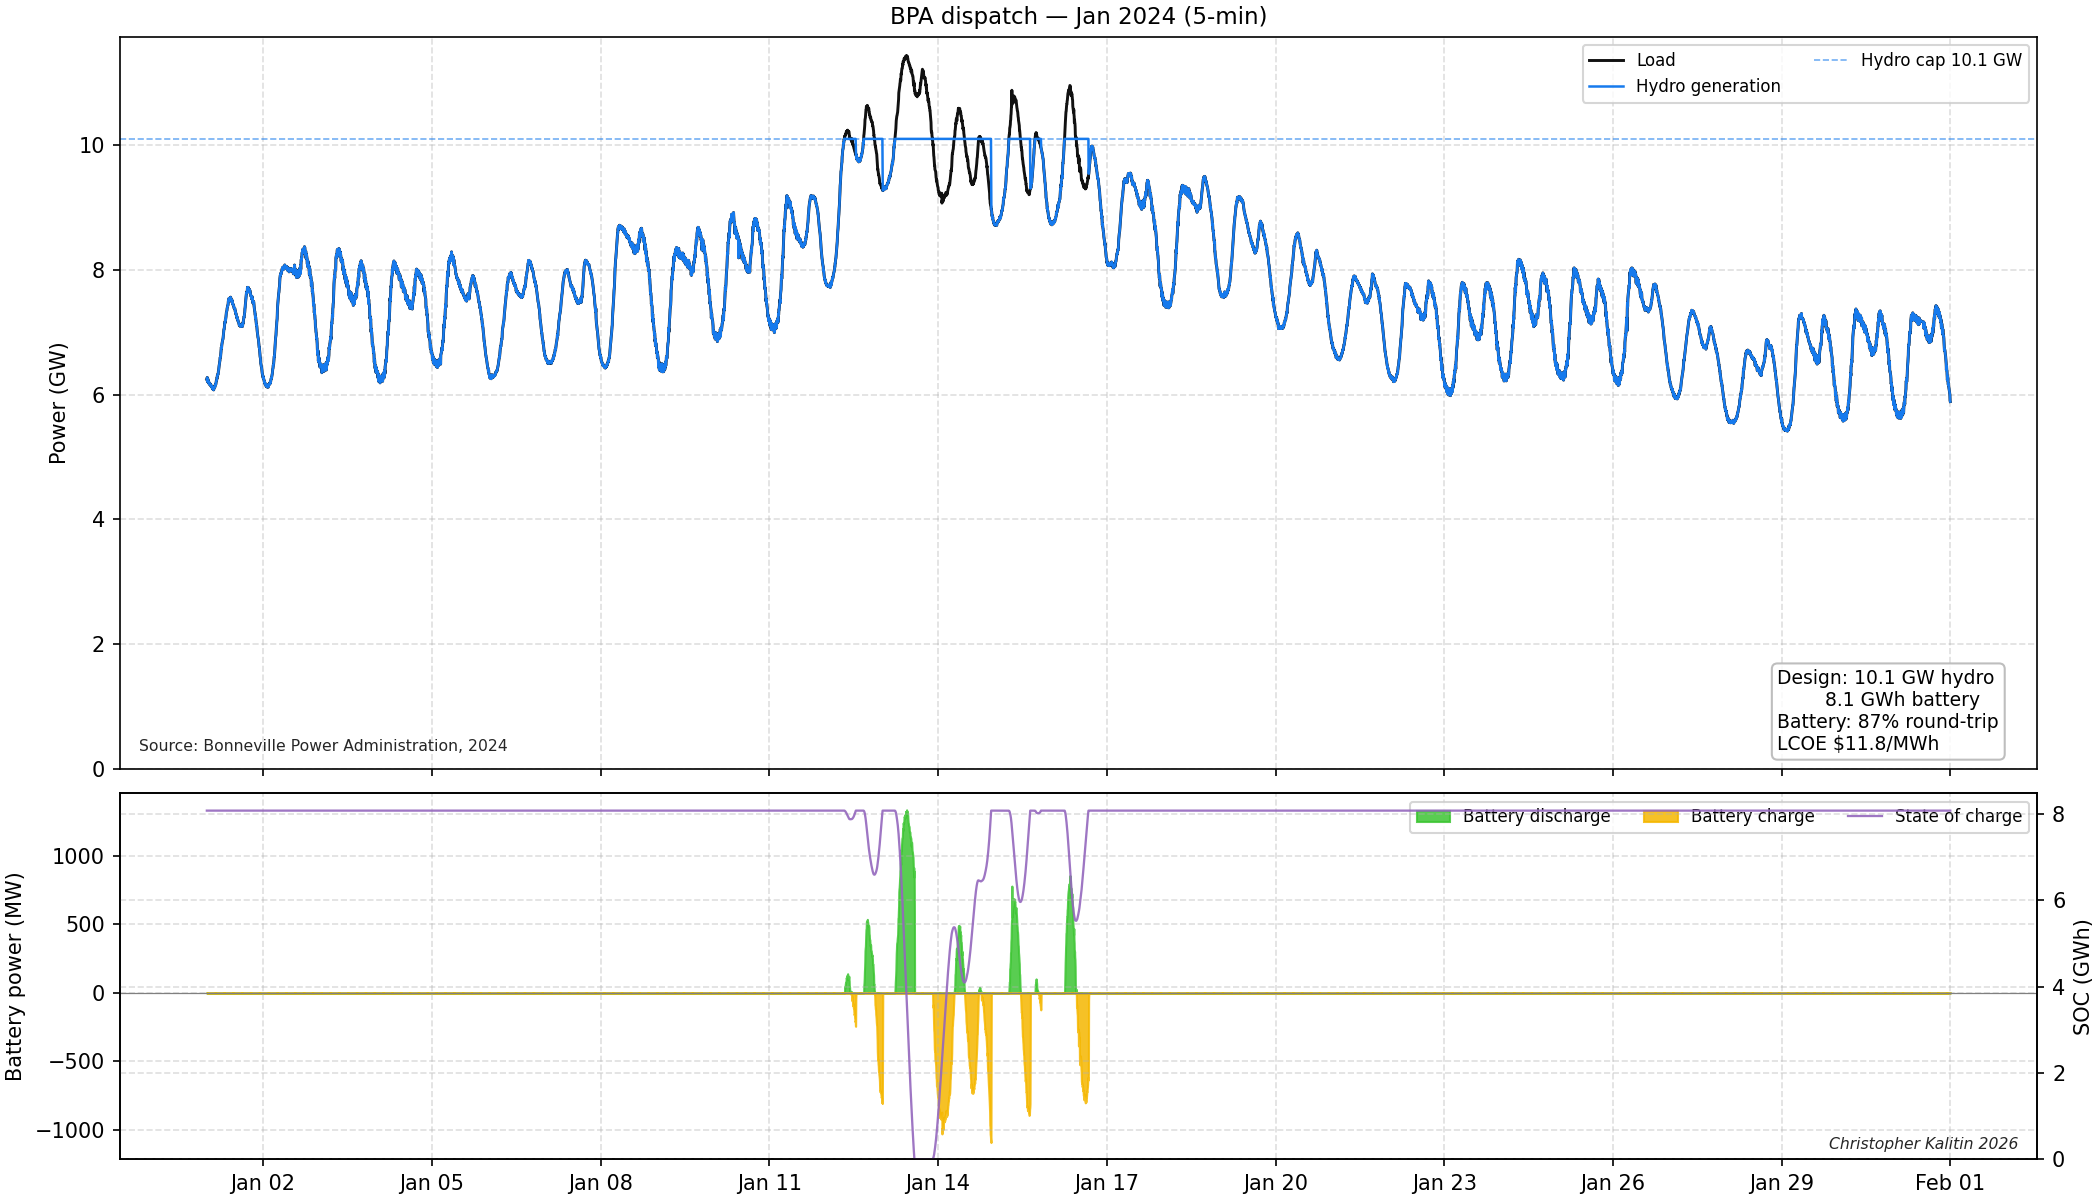
I wasn’t satisfied with my analysis so now I’ve taken the load on the BPA grid (American Pacific Northwest) and sized a hydro + battery system to it from that raw data (assuming no water flow constraint).
Interestingly, the result was that the cheapest system at >99.99% utilization is one in which batteries only supply 40 hours of load over the entire year (2024 data).
The optimal point has 10.1 GW of hydroelectric generation and 8.1 GWh of batteries.
Batteries aren’t even required for load smoothing on such a grid because the dam’s handle it for the entire year.
My instinct is that you’d trade off some turbine capacity for batteries to get cheaper, but because of the 99.99% requirement, you don’t get to that point.
Fundamentally, generation is productive and storage is only arbitrage. So, the optimization is always to increase generation.
With unused generation, you can do something useful like building a new aluminum smelter. However, with unused batteries you just are left waiting until a particularly cold day in January when everyone turns on their heat.
High utilization always favors overbuilding generation, not overbuilding battery storage. This is true for solar and for hydroelectric dams + batteries.
This is a very fun result because it went completely contrary to my intuition, which told me that you could have less turbines if you built more batteries and get a new lower cost. Turns out high utilization AND lower cost both push you in the opposite direction!