S-Curves Allow You to Predict the Future
I’ve decided I’m going to be an Econophysicist.
Historic Proof for S Curves
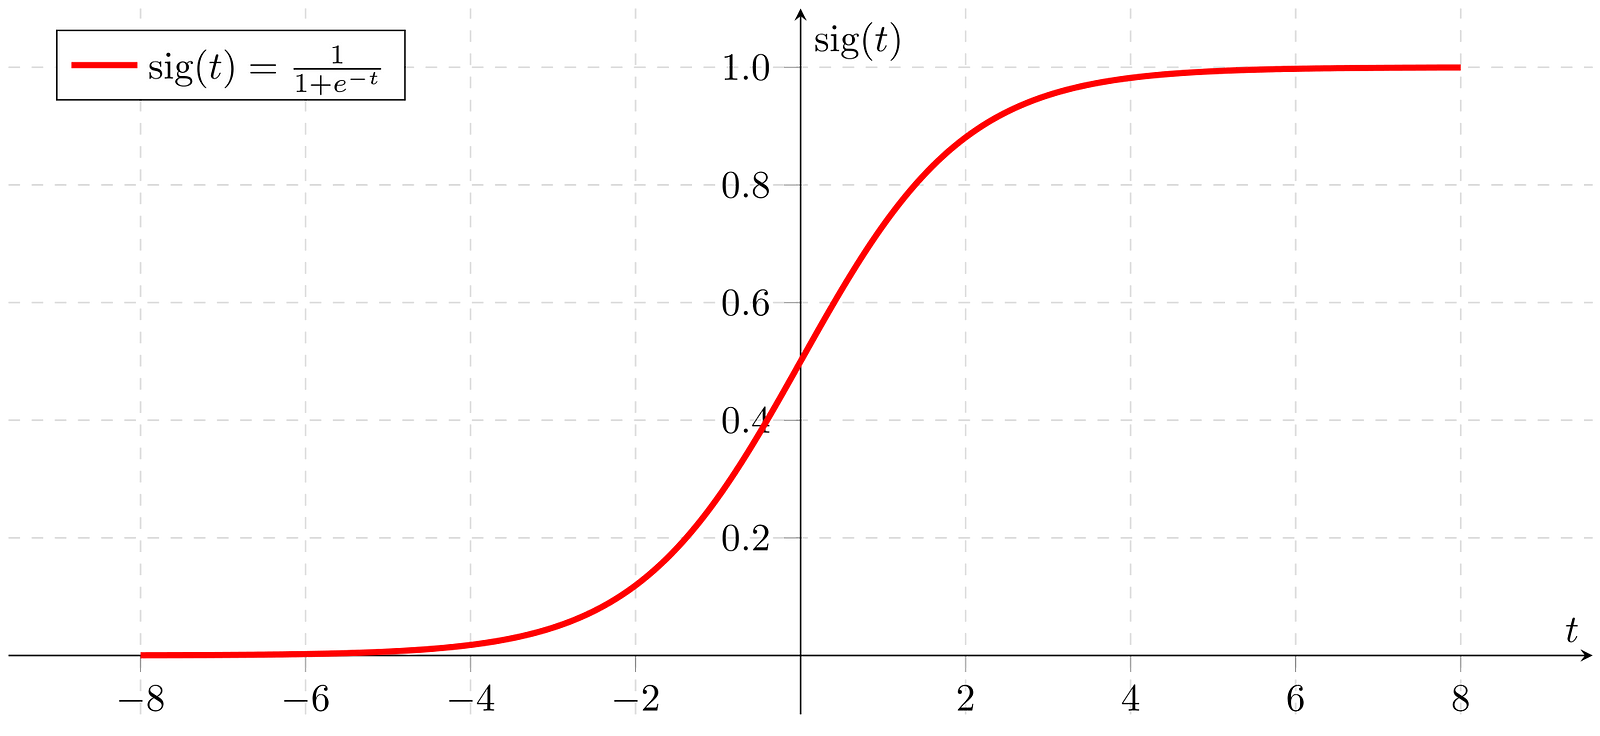
An S curve is a function that describes the shape of the market share vs. time graphs of almost all technologies. These S-curves are characterized by an extremely slow start, where they are arbitrarily close to zero; an exponential growth phase; then followed by a levelling off where they asymptotically approach 100% market share.
These S curves give you the ability to predict the future with a high level of certainty. Psychohistory brought to reality (Read Foundation). The reason you can use this method to predict the future with such high certainty is that the growth of almost all technologies that we have ever invented have followed the same pattern: the S curve.
At the beginning of this year I began work on my longest blog post yet, The Transition to EV Robotaxis. In that post I extrapolated historic data on EV adoption by fitting an S curve to the data. I found that 50% of cars sold in 2027 will be EVs and 90% in 2030. To ensure fitting an S curve was an appropriate method to make such predictions, I aggregated the market share data of several technologies over the past century to confirm whether they followed the same growth pattern. All of these charts are shown below.
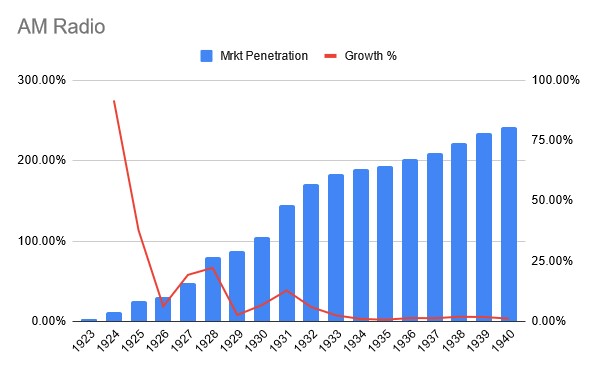
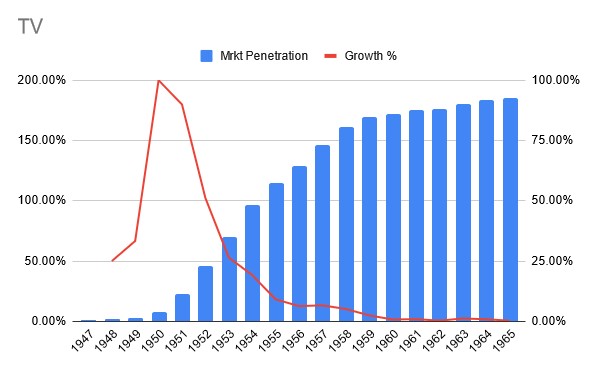
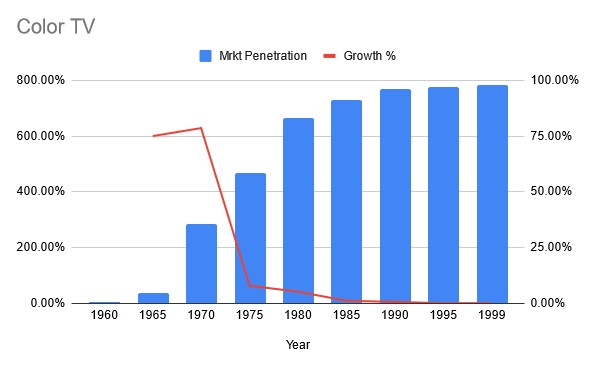
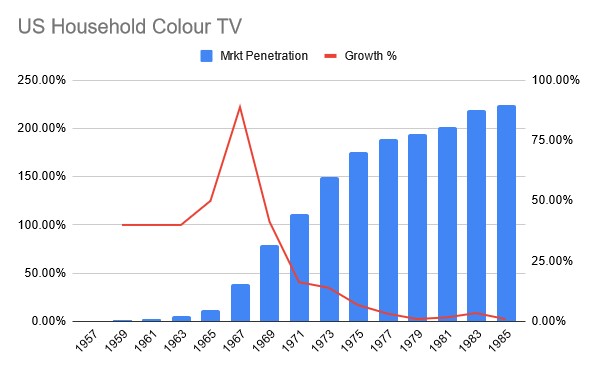
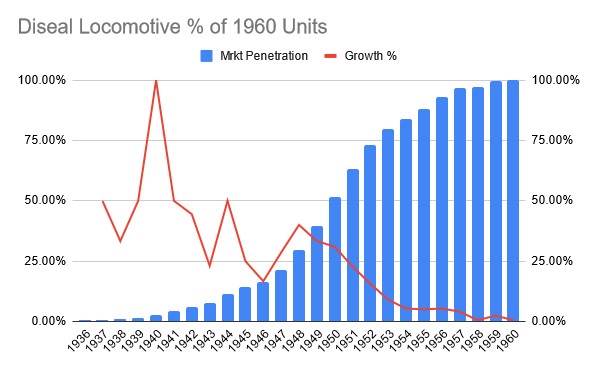
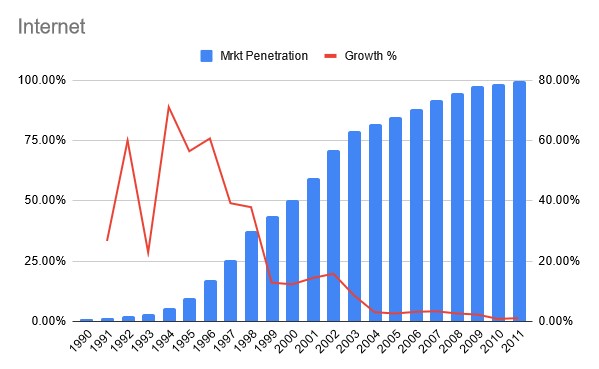
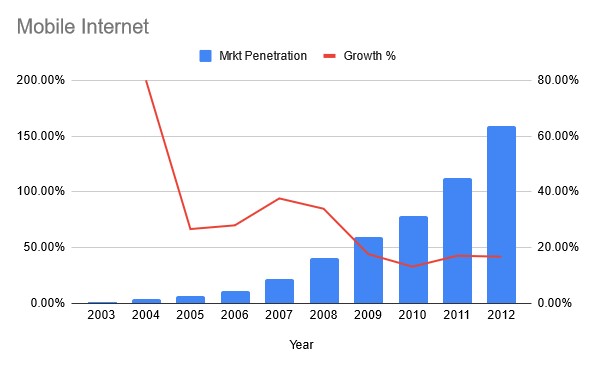
As you can see, all of these charts follow the same pattern. It’s important to note that I didn’t cherry pick any of these, I just searched for growth curves of early technologies and pixel counted to get the data you see above. There may be some edge cases where a technology doesn’t follow the S curve, but for our purposes we will focus on the subset of technologies that do. This is still a very large set such that S-curves are a very useful tool for predicting the future.
More beautifully plotted examples are available in this WEF commercial space report on page 7. Courtesy of @Tim_X94.
Learning Rate Explains it All
If you have the mentality of a school student who only wants to answer the questions on the test, you can be satisfied with the information above and apply it to all new technologies to your heart’s content. However, if you’re destined for great things, you must understand why S curves happen from first principles.
As Casey Handmer (Highest information density speaker alive) explains in this clip and elsewhere, the fundamental reason that technologies follow S curves is the exponential growth that occurs when learning rate is allowed to compound.
Learning rate is the percentage decrease in cost that a technology experiences as a result of a cumulative doubling in production. For example, batteries currently have learning rate of about 20%. Batteries double in production about every 2 years and fall in cost by about 20%.
The framework of applying learning rate is most useful for new exponentially growing technologies where doubling time is low. For example, EVs have a doubling time of about 2-3 years. If we extrapolate this out a few years we find that we will undergo a massive paradigm shift where EVs become the most common vehicle type on roads. Electrical transformers can also be described by a learning rate, but because they are such a mature technology the learning rate is only 4% and doubling time is very long.
Like Handmer explains, exponential decrease in cost (described by learning rate) is due to the reinforcing cycle of increased demand which leads to increased production which leads to decreased cost which leads to increased demand. As a product increases in volume, the revenues from the product increase, which allows for further investment into R&D and production, which further decreases cost and increases the desirability of the product.
The most famous application of this framework is Moore’s Law, which states that the number of transistors in an integrated circuit doubles about every two years. Moore discovered this with only about 4 points on the graph of transistor count vs. time. Because learning rate appears to be a fundamental law of the universe, he was able to predict the future of integrated circuits far into the future with a high level of certainty.
An even more remarkable fact about Moore’s Law is that it applies to computers that existed well before Moore stated his law. When we look at the electromechanical, relay, and vacuum tube based computers that came before integrated circuits we find that the trend of exponential growth was present long before Moore’s Law was discovered. Learning rate even works in the backwards direction before we ever thought about it!
The Life Cycle of a Technology

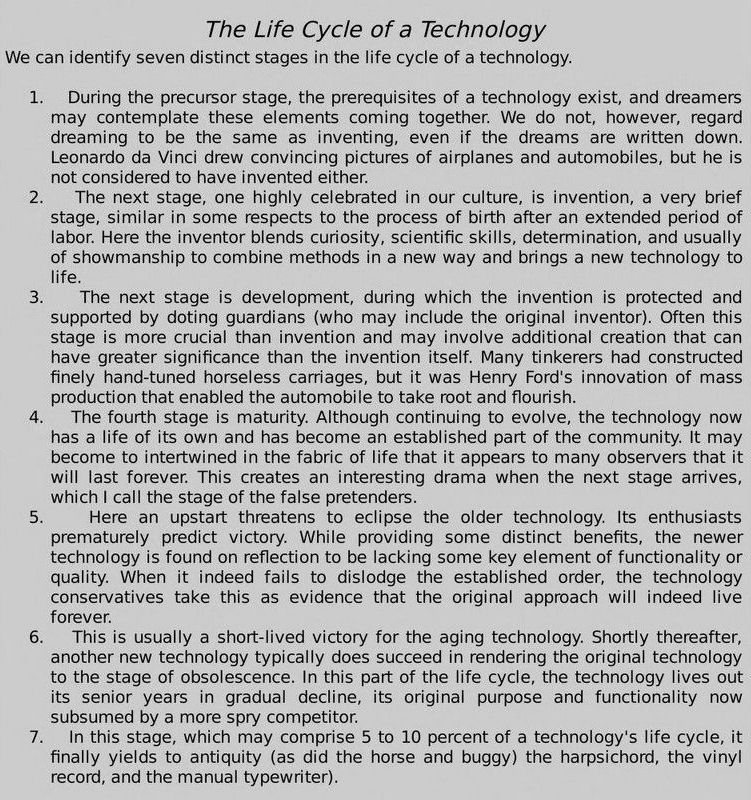
The Singularity Is Near, Chapter 2, page 105 on Internet Archive
Above you can see the seven stages that Ray Kurzweil laid out for the life cycle of a technology. The Singularity is Near was the first place I was exposed to these ideas presented in such a concrete manner. My first blog post was about insights I gained from this book, you may also want to read it.
A technology goes through five majors stages that can be described by its S-curve. These stages are:
- Early R&D
- Initial Commercial Appeal
- Obvious exponential growth
- Market Saturation
- Stagnation
1. Early R&D
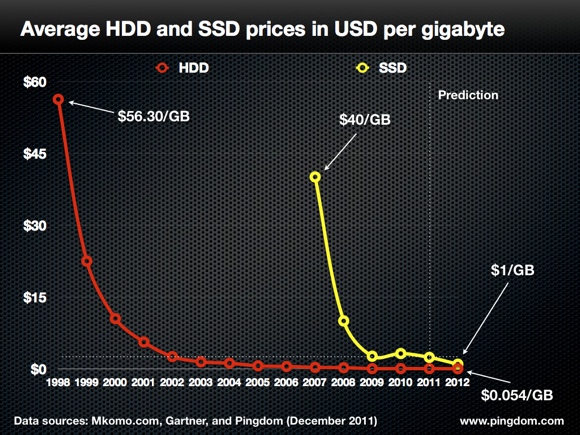
The early growth of a technology is characterized by exponential improvements that do not make much of an impact for its total market share. The technology may be exponentially improving, but it is still not good enough for anyone to use it at scale. For example, Solid State Memory (SSDs) were conceived of in 1978 and were first released as a product in 1991. However, it took until the late 2000s for costs to drop low enough that they were considered a reasonable alternative to hard drives.
2. Initial Commercial Appeal
After this initial R&D phase, there is a smooth transition to a phase in which the technology begins to be adopted. It has exponentially declined in cost enough that it has its own niche. An example here is golf carts, they are a relatively small and niche market compared to all other vehicles, but it just so happens that the electric powertrain is more optimal for the user experience than an internal combustion engine. This means that electric vehicle technology can be adopted to golf carts, which in the grand scheme of things isn’t a very large market, but is just a step along the path to market domination.
3. Obvious exponential growth
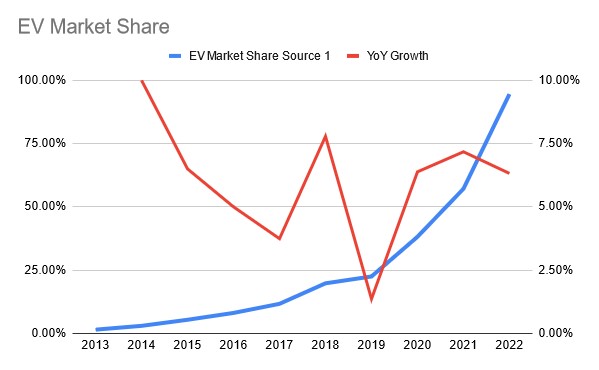
Another gradual and smooth transition occurs from the second phase into the third, exponential growth. The technology has declined in cost and improved in capability enough that it is now the best option for a large portion of the market and it begins to take significant marketshare. We are living through this today with EVs. Pure electric vehicles currently have around 25% market share worldwide and the current growth rate is around 50%. Extrapolating this out a few years, we find that EVs will be the most common vehicle type on the road.
Because the exponential growth in this era is driven by economic factors (decreasing cost and increasing capability), the growth continues even through recessions and depressions. For example, look at the charts on AM radio during the Great Depression and EV adoption during Covid.
4. Market Saturation
No product can grow exponentially forever as we live in a finite universe. Once the market for a technology has been saturated, growth rates begin to decline. Now, unlike phase 2 where the technology only had its own niche, the technology makes everything else a niche. Horses were dominant before the internal combustion engine, but now are mainly used for niche recreational purposes, meanwhile the internal combustion engine powers the majority of vehicles.
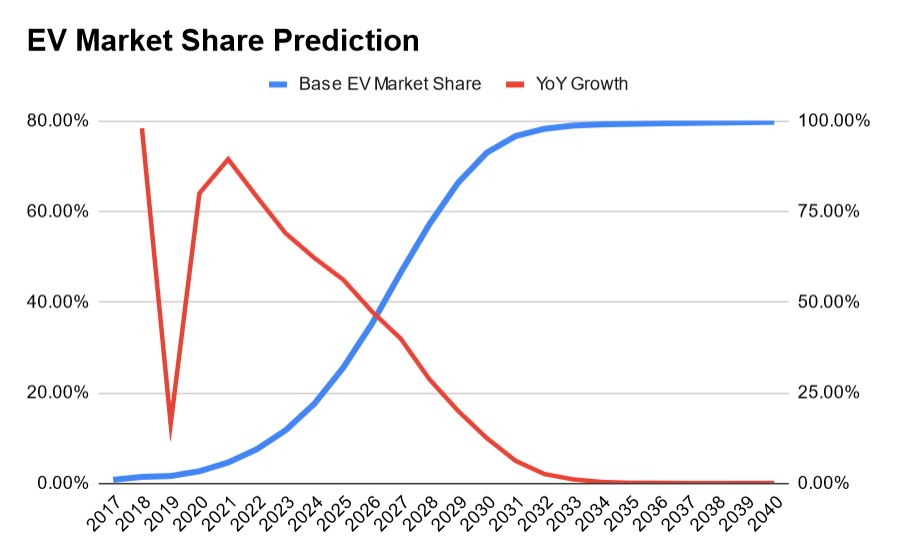
It’s important to note that growth rates linearly decline as a technology increases in maturity. This is again due to the fact that no technology can grow forever. You can see this in any of the charts above or my prediction for EV market share. Also, given a linearly declining growth rate, the magic of derivatives means that we get a nice smooth exponential looking curve. Next time you hear that the growth rate of EVs is declining, remember that this is a byproduct of market domination.
5. Stagnation
In the final stage of a technology, it asymptotically approaches 100% market share and we await another disruptive technology to emerge that displaces the current paradigm. We currently see this in internal combustion engine powered automobiles. We have had these products for over a century and there are very marginal improvements in their efficiency and cost. Most of the improvement we’ve seen in vehicles recently has been in comfort and other user-focused features.
The End of Learning Rate and the Death of a Technology
In the final stage of the life cycle of a technology, we see the end of learning rate and the slow death of the technology. As we learn more about how to harness a particular technology, we near the limits of the technology. This means that the once constant variable of learning rate begins to decline and the technology stagnates. Once you’re in this stage, applying learning rate is no longer a very useful exercise to understand the future of the technology because the technology has very little future apart from what it already is. This is why learning rate is best applied in stages 2-4.
This stagnation is the time period in which we can hope to see a better technology arise that will supercede the current technology. In some cases, waiting for the emergence of this new technology can be a very long process that has extremely major consequences for the future of humanity. We are unable to predict when this new technology will emerge if it is still early in stage one - unless you have a perfect mental model of all similar technologies that are currently being researched and are able to predict their success.
Waiting on these new technologies can have major implications because of the impacts of the current technology. For example, Climate Change is caused by the previous/current paradigm of Hydrocarbon-based fuels. This technology was a huge win for humanity hundreds of years ago and allowed us to build the modern world and feed billions of people living better lives than they ever have. However, this technology has now begun to stagnate and we are seeing the negative impacts of it (citation needed). The solution to Climate Change is the next energy technology which will elevate humanity into a new era of unprecedented prosperity. Solar panels are batteries are declining in cost exponentially and will replace the vast majority of previous energy technologies in the coming decades. Modelling this out is left as an exercise to the reader.
The inherent hope of this perspective is that as long as humanity continues to develop technology, all of our problems will be solved and we will continually prosper to greater and greater levels. However, this isn’t automatic! We must continue to work extremely hard to develop new technologies! The fundamental input into all technologies is human labour and we are that labour! You are that Labour! You have no clue how good the future is going to get when you work harder!
Appendix: More Examples of Applications of S-Curves
I’m currently reading Eccentric Orbits: How a single man saved the world’s largest satellite constallation from fiery destruction. This book covers the Iridium satellite cellphone call constellation and it goes through a great example of an S-curve that looks like many discrete processes at first glance. The first stage began with the Motorola study into building a satellite constellation for handling phone calls began around 1988 (phase 1). The Iridium constallation began deployement in 1997 and the first call was made over the network in 1998 (Still phase 1). They had a brief encounter with bankruptcy and later began scaling the constellation and launching a new generation of satellites as revenue increased (Phase 2). At this point the Iridium phones were still a very niche product without much market penetration except in the very unique cases in which there was no better alternative. Next, Starlink entered the satellite internet market and began growing exponentially (Phase 3) (Note: I keep stubling upon this Brian Wang guy writing about SpaceX). We’re currently living through phase 3 of the S-curve, in a decade or two we’ll see Starlink reach market saturation and a few decades after that Starlink will be replaced by a new, better techonlogy.
If you imagine yourself at any stage in the story detailed above except the current one, it would not look like any exponential growth was occuring or like you could apply learning rate to understand the future of the industry - part of the reason for this is that little data would exist to determine learning rate or see the S-curve. You could be living through the brief bankruptcy of Iridium and think that the technology was a failure, but the underlying technology was still improving either through direct research or through external development. For example, while the original proposal for Iridium was being worked on at Motorola, satellite buses and other components were gradually becoming less expensive, and by extension the cost to develop a satellite internet/call constellation constellation was decreasing (Exponential Growth).
Appendix: Latent Demand
Latent demand is desire for a product or service that currently isn’t offered in the market. Like I mentioned in the previous appendix, there are situations in which the fundamental technologies behind a product improve without direct investment into that product. For example, solar cells leverage semiconductor lithography which has been improving for decades due to investments into integrated curcuits. Over several decades, the fundamental technology behind solar cells was improving and decreasing in cost even while there was little direct investment into solar cells.
So, the theoretical price for solar was decreasing and hence the theoretical demand for solar was increasing. However, these prices had to be realized by increasing production through direct investment into solar cells. This means a technology can have a long period of indirect advancement, followed by a period of brief extreme growth that realizes the gains of the previous time period.
Another example is Starlink. There is a lot of latent demand for internet in rural areas and other locations that are not adequately served by current internet providers. However, there was no way to affordibly meet this demand. Existing companies like Iridium and all the others tried to meet this demand but could not do so. In comes SpaceX, which leveraged decades of materials science, electronics, and rocketry advancements to build the partially-reusable Falcon 9 which allowed them to launch the Starlink constellation at a low enough cost that they could provide affordable and high performance satellite internet service to underserved customers.
Throughout the decades before Starlink, satellite and launch vehicle technology was improving but these improvements were not being properly realized. Legacy launch companies like ULA had very little incentive to decrease cost and increase cadence. This never allowed an opportunity to get the exponential, compounding growth that learning rate describes. My blog post NASA’s fucked - Here’s my vision goes into some of the perverse incentives in the space industry that prevented this growth. In short, there was never a good enough opportunity for a company to create a satellite internet constellation before SpaceX came along. SpaceX realized decades of improvements in rocketery and pushed the field forward themselves to build the fundamental technology needed for a successful and profitable satellite internet constellation.