Jevons Paradox is Just a Subset of the Principle Behind Learning Rate
For feedback / criticism, please reply here.
“It’s not really an explanatory power to take Moore’s law and then just kind of extrapolate.”
- Casey Handmer
Introduction
Jevons Paradox is the observation that when technological advancements make a production process more efficient, instead of decreased resource usage (as you’d expect), the usage of that resource increases. Essentially, with more efficient methods of utilizing resources, we actually end up using more resources, not less.
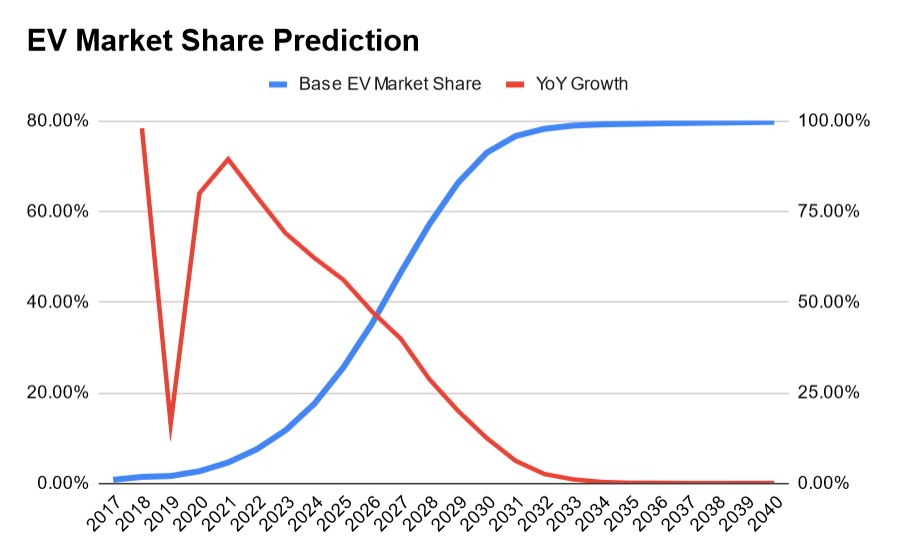
Above is a chart that shows my prediction for EV market share. This prediction applies the principle of learning rate to predict the future of the car market.
In a previous blog post, S-Curves Allow You to Predict the Future, I showed how the framework of learning rate can be applied to predict the future. In short, all technologies follow the same general pattern of cost decline and demand increase. This pattern is followed so regularly that you can use it to predict certain products/markets into the future with high accuracy.
The S-Curve is the graphical representation of this principle, which you can see in the chart above or in my previous blog post. In the most basic sense, you can just fit an S-Curve to existing market data, and extrapolate into the future (so long as you check your assumptions carefully!).
Learning Rate is the percentage cost decline for a cumulative doubling in production. For example, batteries currently have a learning rate of about 20%, meaning for every doubling in production (about every 2 years) they fall in cost by about 20%. Casey Handmer explains part of the concept in this clip and the rest is explained in my previous blog post.
Expressing Learning Rate With A Simple Diagram
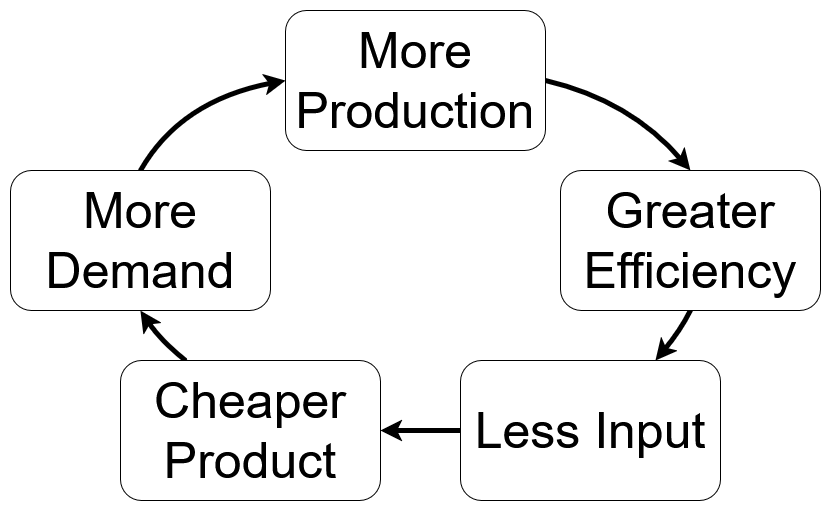
Super simple diagram that shows the principle behind learning rate.
The diagram above can be used to describe the flywheel affect of learning rate that allows us to seemingly magically get 12% cheaper solar panels every year in perpetuity. It shows the casuality between production, efficiency, cost, and demand.
To illustrate the diagram above, consider the example of a given technology which for a decrease in cost of 10% has a marginal increase in demand of 20% leading to a marginal increase in production of 20%. After we go through a few intermediary steps in the diagram to be covered later, we get back to a marginal decrease in cost of 10% and go around the loop again. This is a reinforcing feedback loop, which means that the technology will continue to grow until it reaches saturation. At saturation, the change in marginal demand as a function of cost and the change in marginal cost as a function of production will both equal 1 (ie. 0% growth when multiplying).
Note that in this case “saturation” refers literally to market saturation. For example, the market for automotive vehicles is mostly saturated at the moment with little growth, the flat end of the S-curve.
During his interview on S3, Casey Handmer described the same idea in less words and in a more esoteric manner (took me a while to understand):
“You have to understand why if you reduce the cost by 10% you’ll increase demand by 20%, if you increase demand by 20% you can increase production by 20%, if you increase production by 20% you’ll lower the cost by 11%.”
“If you’re able to lower the cost by more than the marginal increase in demand demands increase in production you have this extremely positive feedback loop.”
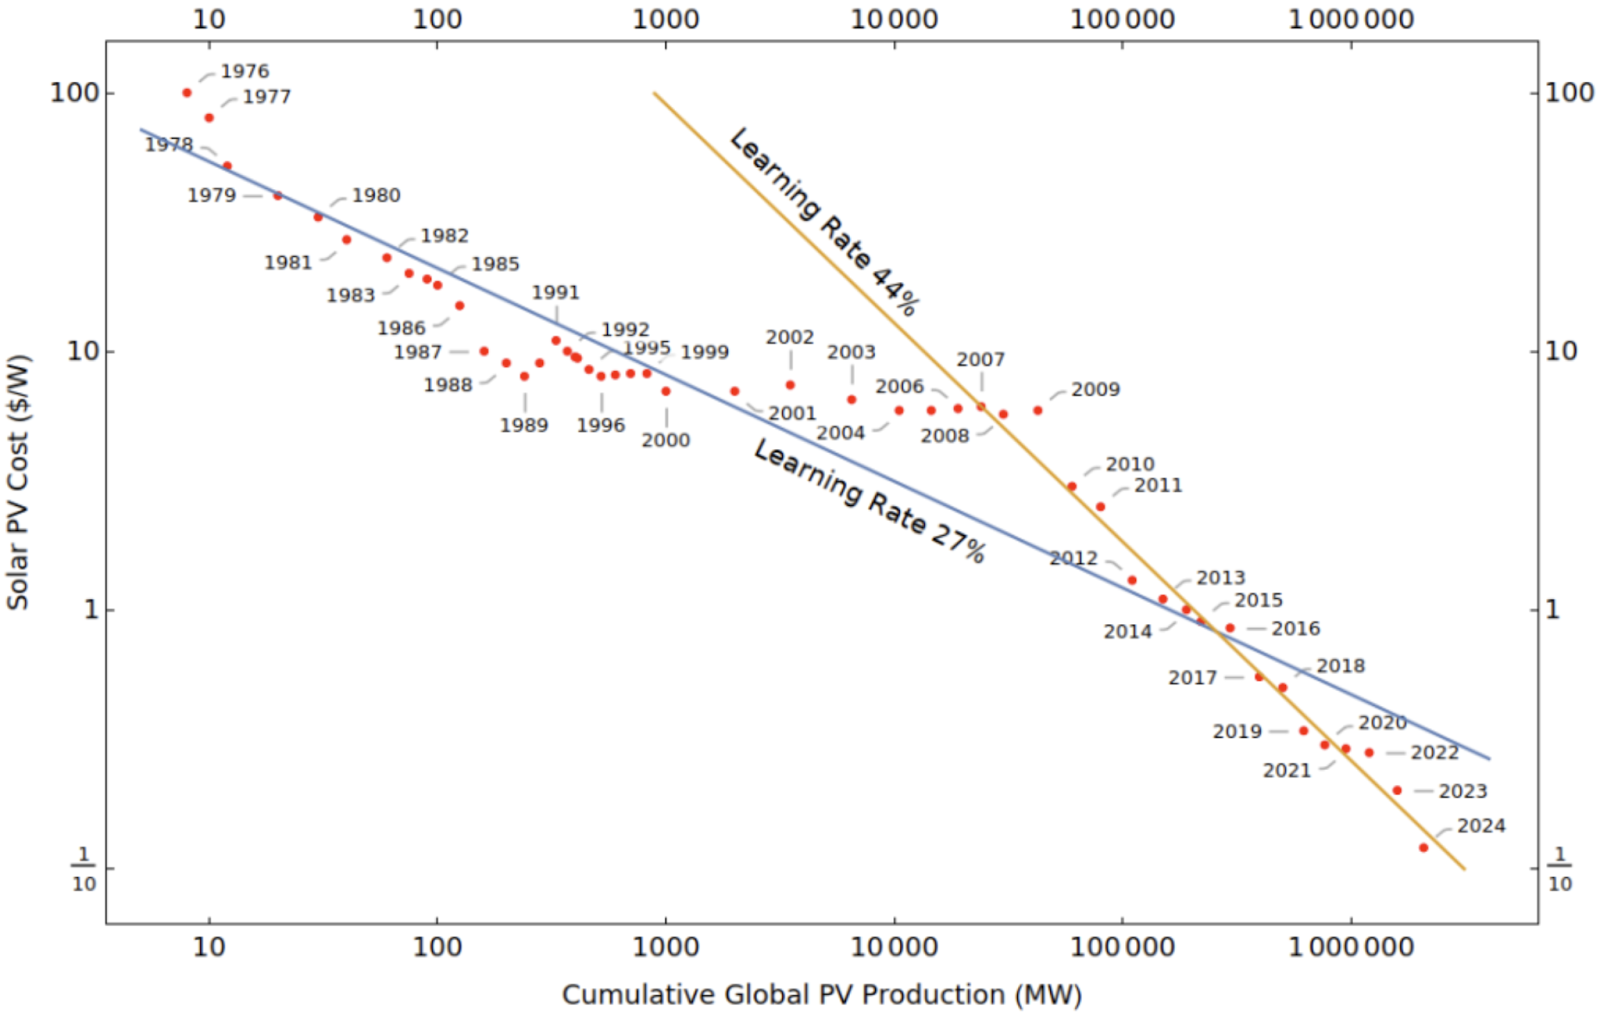
Casey Handmer’s graph of solar cost decline.
Looking at examples in reality, cost decline as a function of production is almost always described by a constant, as this graph above shows. During some time periods you get a gradual or sudden change in the slope of the curve, but in most years fitting a constant is a good approximation.
Jevons Paradox and Saturation
Now that we have a framework and a nice diagram to describe the principle of learning rate, we can apply it to Jevons Paradox.
In the feedback loop described above, Jevons paradox enters in from the increased efficiency stage. This leads to a decrease in the input materials for a given manufacturing process, which as we saw leads to decreased cost, increased demand, increased production, and back to decreased cost as we go around the loop again.
Cheaper use of a resource stimulates more of its use! This is the essence of Jevons Paradox, but if it were so simple it would not be called a paradox.
The paradox comes from the delayed effects of an increase in efficiency. Often individuals make the mistake of assuming constant demand when modelling the effects of increased efficiency. This assumption is a fair approximation in the short term, but in the long term it is incorrect. Furthermore, the long-term effects dominate the short-term effects when looking at the demand function of a given technology/resource.
This is why more efficient steam engines led to more coal consumption in Britain during the industrial revolution. In 1865 - when Jevons made the observation that now bears his name - coal consumption was not near saturation in Britian (and wouldn’t be until the 1950s). Because coal consumption was exponentially growing, we conclude that the marginal increase in demand as a function of cost was much greater than the marginal decrease in cost as a function of production. This means an increase in efficiency would lead to a decrease in cost and an even greater increase in demand, and the cycle continues.
The defining characteristic here is that the marginal increase in demand was much greater than the marginal decrease in cost for a given increase in production. This led to a large increase in demand for a modest decrease in price from a modest increase in efficiency. Essentially, an increase in demand of 10% leads to an increase in production of 10% and an even greater decrease in cost (eg. 20%). Jevons paradox is most pronounced when the difference between the marginal increase in demand and the marginal decrease in cost is large (eg. 10% and 20% respectively with a 10% delta).
In the case of coal consumption in Britain, over time the magnitude of the difference between the marginal increase in demand and the marginal decrease in cost decreased. This led to a slower growth rate and eventually the stagnation of the coal industry in Britain and the rest of the world.
On page 14 of Energy and Civilization, Vaclav Smil describes this phenomenon with this quote:
“In affluent countries, those whose high per capita energy use has approached, or already reached, saturation levels, the effect [Jevons Paradox] has been getting weaker.”
Further Fundamental Questions & Observations
1. YOU Make Learning Rate Happen!
“People sometimes think technology just automatically gets better every year, but it actually doesn’t. It only gets beter if smart people work like crazy to make it better.”
- Elon Musk
In my first ever blog post I made the mistake of assuming that the growth of humanity is assured. Since then I saw this clip of Elon where he demonstrates that technology does not automatically improve and it in fact requires a great amount of human effort to make it happen.
You are a human! It is your effort that makes technology improve and you are the one who can build us a beautiful future! Fundamentally, “an economy is productivity per capita times capita” (Elon Musk), and you are a capita! You do actually have an impact on the future of humanity at the margin!
It is learning economics that made me truly appreciate this point. Through this and my previous blog post I laid out the framework of learning rate and how it can be applied to predict the future. We must remember that the best way to predict the future is to create it!
I use the framework of learning rate to choose what I will spend my life working towards. Like Ray Kurzweil descirbes in The Singularity Is Near, I will use this framework to predict the future of humanity, and then work extremely hard to make that future happen.
You build our future! Make sure you work on the right tech stack!
2. Predicting The Ceiling Is Essential to Modelling the Future of Humanity
During previous modelling exercises I’ve tried to model the future of electric vehicles, autonomous vehicles, humanity’s mass to orbit capability, humanity’s energy use, and a lot more. Creating accurate models of the future is a lot easier when you can apply learning rate to the problem and have a known ceiling.
For example, the growth of EVs can be predicted with a fair amount of accuracy by plotting the points on the curve of market share and assuming that the current vehicle market is the ceiling. However, this is only a fair approximation if your assumption of the ceiling is correct.
In markets without a ceiling, you have to check your assumptions extremely carefully and you will still likely end up way off in your final prediction. In moments like this it is more important to be directionally correct and have an understanding of the general magnitude of the change than it is to be precisely correct.
My previous modelling exercises have been very useful in showing the fundamental importance of checking your assumptions. A proof-based calculus class further solidified this.
3. Why Exactly Does Greater Production Lead To Greater Efficiency?
The most fundamental unanswered question I have in this domain is why exactly does greater production lead to greater efficiency?
The most common answer I’ve seen is just applying the term “economies of scale” to the problem and calling it a day. However, we must remember Casey Handmer’s quote from the beginning of this blog post and not blindly extrapolate.
During the growth of a technology a lot of learning about its production occurs and many fundamental innovations are made to increase efficiency and performance. The combustion of hydrocarbons went through an extremely high number of iterations before we got modern large-scale high-efficiency combustion engines.
Combustion went from opening burning of wood, to inefficient early creation of charcoal through pyrolysis in a dirt pit (~8% yield of charcoal from wood mass), to the creation of charcoal in advanced brick furnaces with recirclutating wood gas (~30%+ yield), to peat, to coal, to the creation of coke (high carbon coal usful for metallurgy), to early steam engines, to high-pressure steam turbines, to the first internal combustion engines (4% efficiency), to the Diesel engine (25% efficiency), to further uses of liquid hydrocarbons (I’ve only gotten this far in Energy and Civilization, see my notes).
During ever step on this path, an individual had to make their contribution to the technology. In some cases, like Diesel, this was a single individual who made a breakthrough. In other cases - such as early charcoal production or coal extraction - it is better described as a large number of individuals over vast periods of time making slight improvements to the technology. It is far harder to predict individual research breakthroughs than broad trends of established technologies, it’s too low level for psychohistory (economics).
Either way, it is difficult to make a precise statement about the relationship between the production and use of hydrocarbons, the humans that made it happen, and the greater efficiency processes they created. Making such a precise statement and expressing it formally is fundamental to being able to predict the future of humanity. In this blog post I’ve attempted to make precise statements about a subset of this problem, but to improve my predictive power, more fundamental work is required. This is a far harder problem than just saying “economies of scale” or extrapolating a growth curve and calling it a day.
Another point: “efficincy in production” is a superset of and far broader term than “economics of scale.” It is efficiencies in production that I am concerned with.
Anecdotes
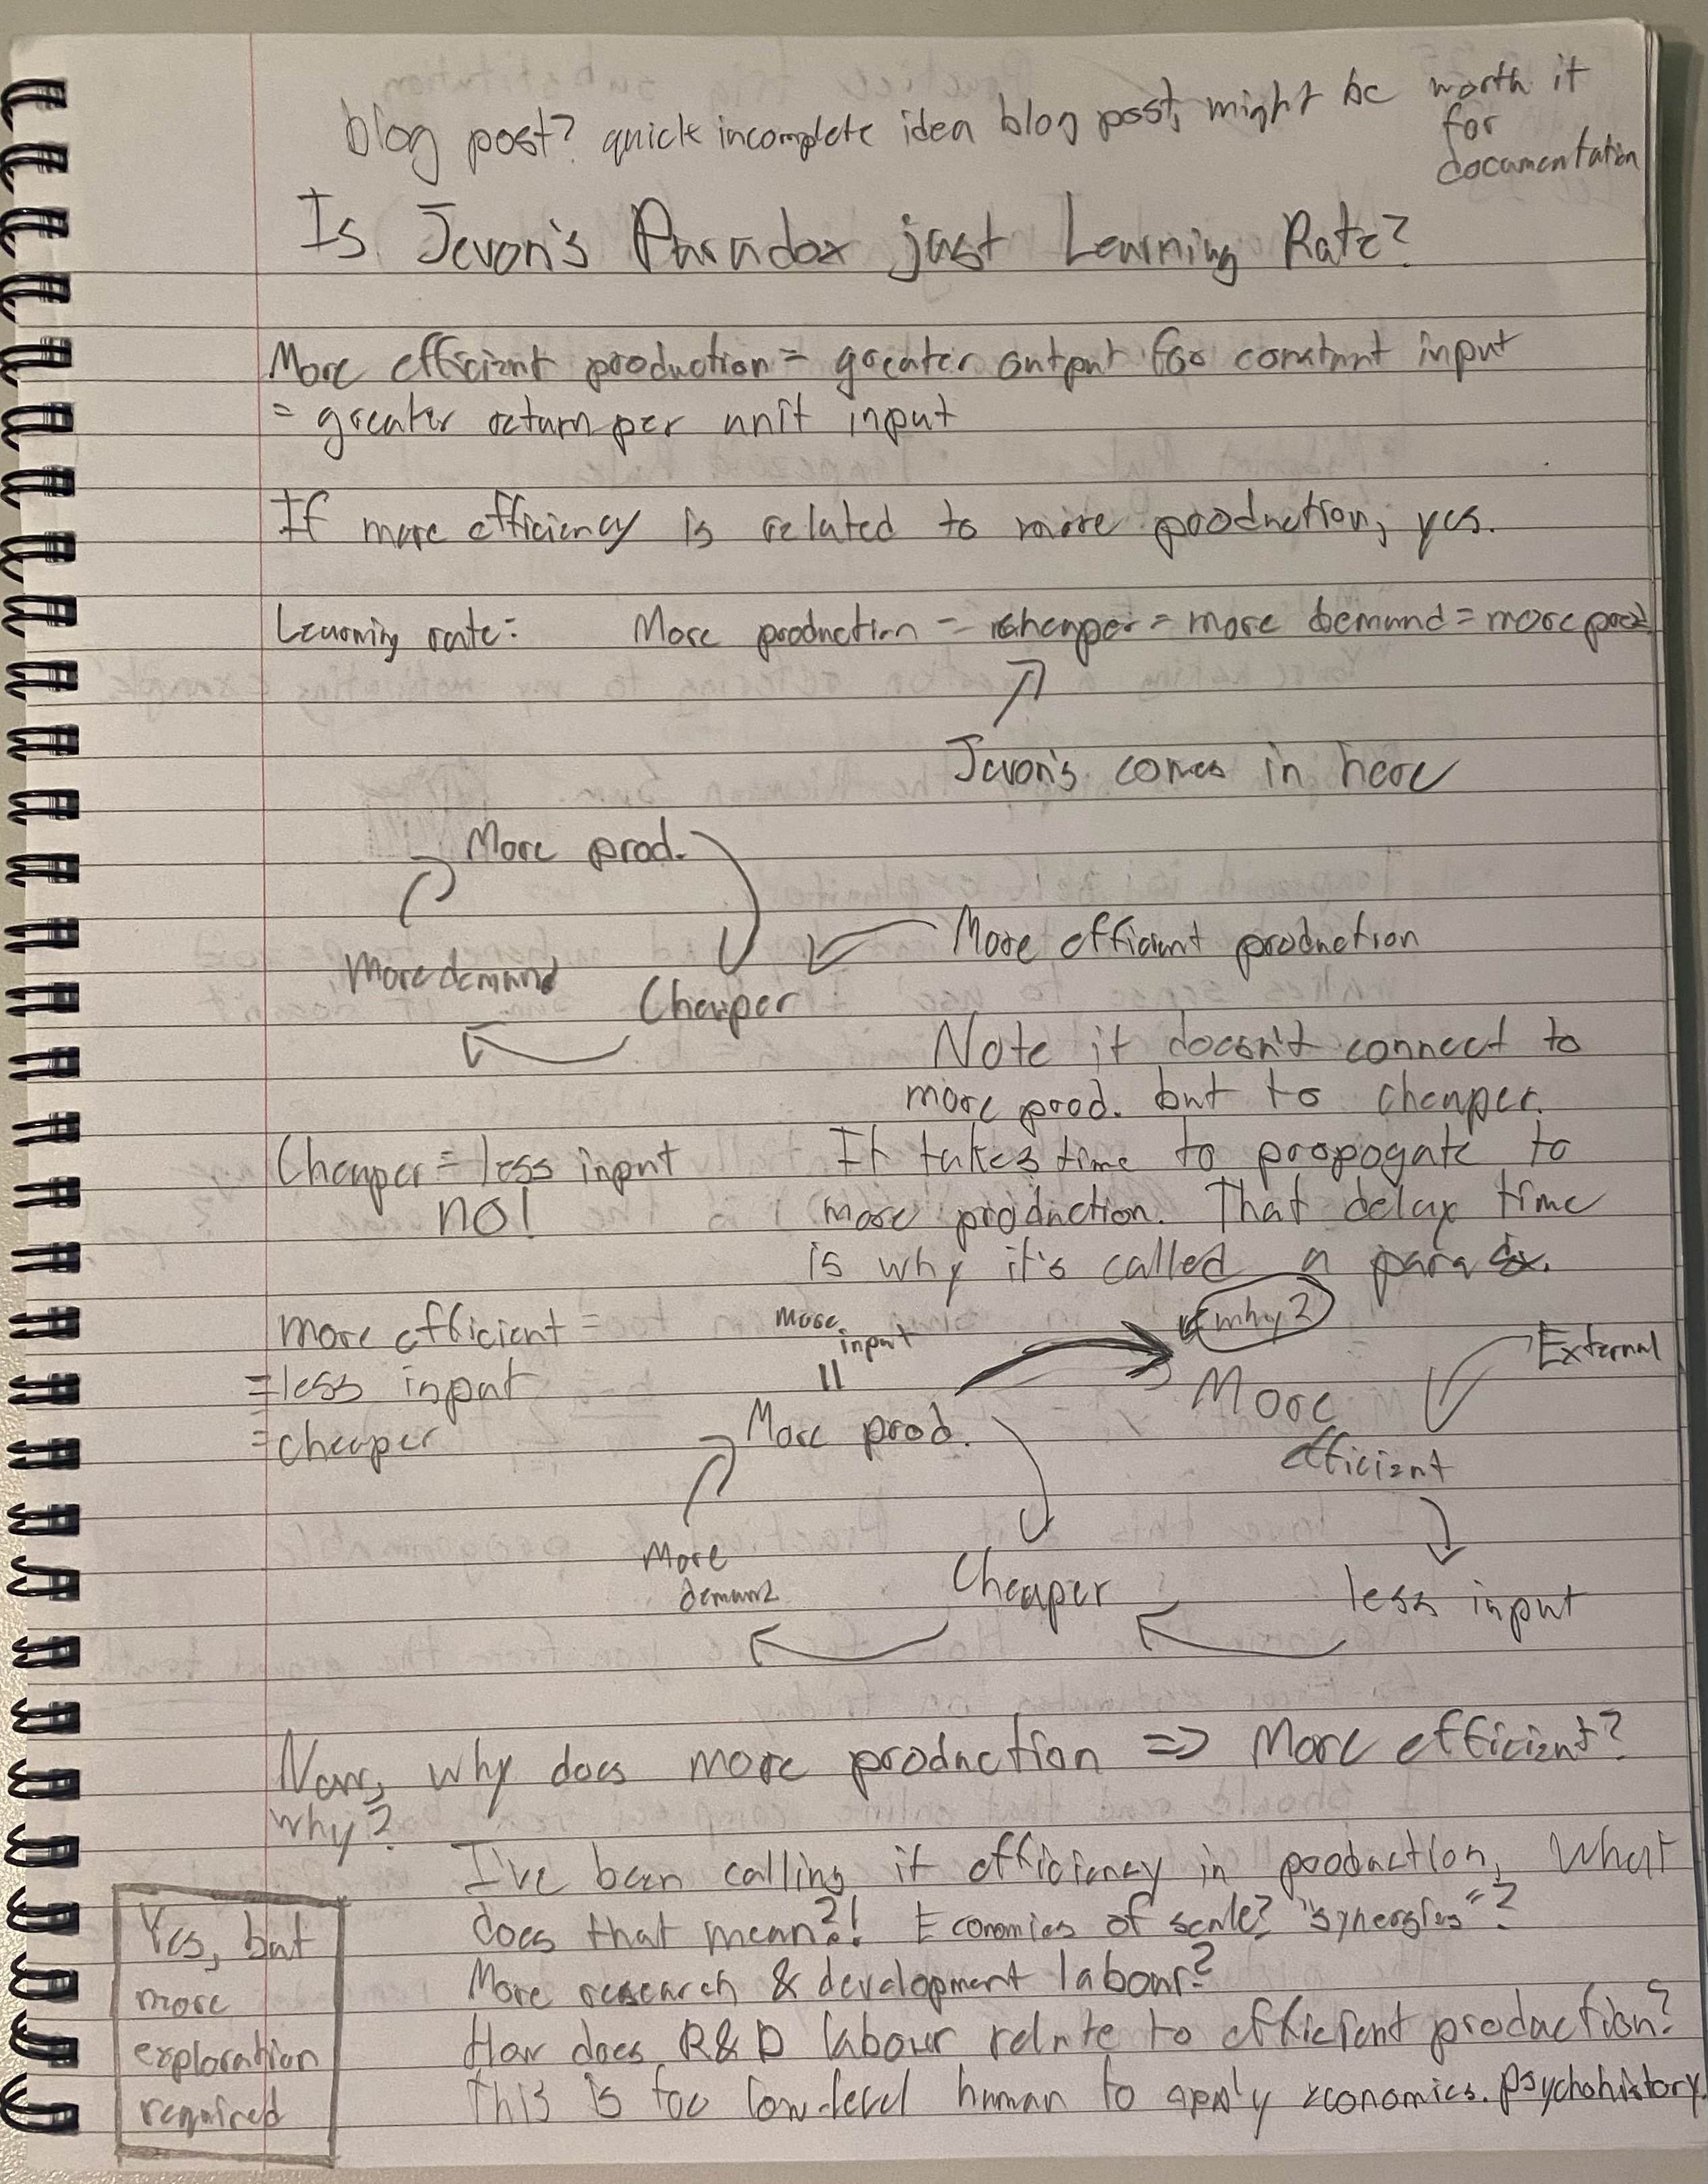
(Expanded Image) These are my notes from math class.
A few months ago I was sitting in my honours integral calculus class and my brain was far too small to understand the subject matter. Naturally, I had the epiphany that Jevons Paradox can be described using the framework of learning rate. So, instead of spending the next 15 minutes learning trig substitution, I jotted down the notes you see above.
Update: I got exactly 50% in that class
This is the commit where Copilot told me about Jevons Paradox. Oct 27 2024.
I first heard of Jevons Paradox from Github Copilot when I was writing some notes on a blog post idea entitled Second and Third Order Effects of Increasing Energy Use. This idea came to me while reading The Capitalist Manifesto, so you might be able to guess at what my take would be. I write all my blog posts in VS Code as .md files, so Copilot is always trying to complete my sentences. Sometimes, it gives me a great topic to cover like Jevons Paradox in the context of one of my existing ideas!
Since then, Satya Nadella, Microsoft CEO, posted about Jevons Paradox in the context of Deepseek supposedly demonstrating greater efficiency in AI training.
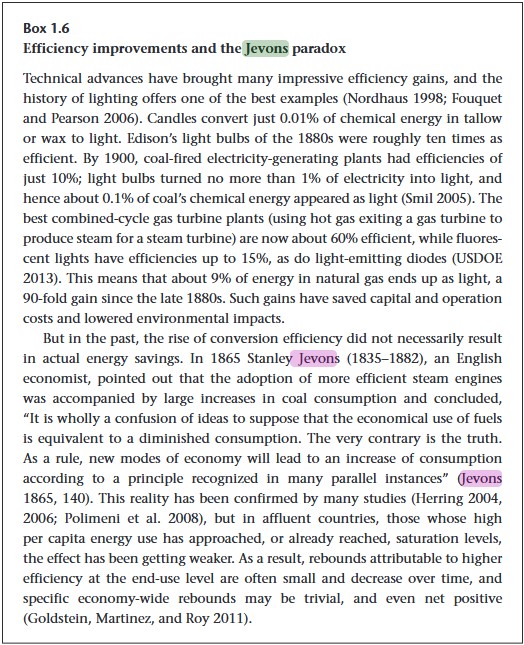
Excerpt from Page 14 of Energy and Civilization.
I once again heard about Jevons Paradox while reading Energy and Civilization. This is one of the great books that takes a very high level idea (“energy”) and connects it down to extremely low level phenomena. The Alchemy of Air is another amazing example.
One great anecdote from Energy and Civilization comes from a description of early attempts at harnessing a fraction of the kinetic energies of wind and water. The direction of these energy flows steered the great late fifteenth-century European transatlantic voyages to the Caribbean, instead of farther north. The same energy flows that allowed us to lower the cost of processing grain through windmills steered Columbus to the Caribbean!